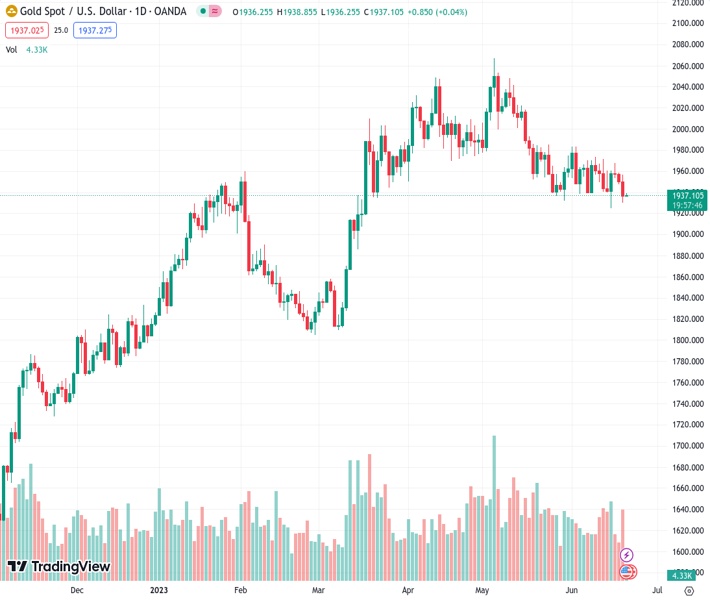
According to the report, the price of gold, currently at 1,936.94 in XAUUSD, is enduring downward pressure after a three-day trend of decline that included breaking through the support level of the 100-day moving average. The author, nehcap, anticipates an additional decline in value.
…
This is a premium post.
[s2If !current_user_can(access_s2member_level4)]Please register for FREE REGISTER to read full post below containing analysis. In case of any error or you think you are not able to read the full post below, please email us at support#nehcap.com [lwa][/s2If] [s2If current_user_can(access_s2member_level1)]
- Gold Price stays pressured after breaking 100-DMA support during three-day downtrend.
The pair currently trades last at 1936.94.
The previous day high was 1956.86 while the previous day low was 1929.82. The daily 38.2% Fib levels comes at 1940.15, expected to provide resistance. Similarly, the daily 61.8% fib level is at 1946.53, expected to provide resistance.
Gold Price (XAU/USD) holds lower ground at the weekly bottom, licking its wounds after a three-day downtrend near $1,937, as market players prepare for this week’s key event, namely the bi-annual Testimony of Fed Chair Jerome Powell. It’s worth noting that the risk-negative headlines surrounding China, hawkish Federal Reserve (Fed) news and upbeat United States (US) data allow the XAU/USD bears to remain hopeful.
Gold Price stays defensive at around $1,937 by the press time, probing a three-day downtrend near the weekly low, as it struggles to justify the risk-negative headlines surrounding Cina and the Federal Reserve (Fed).
Recently, the news that US President Joe Biden on Tuesday called Chinese President Xi Jinping a dictator prod the XAU/USD pair’s recovery moves near the intraday high. The comments flag grim concerns surrounding the US-China ties after US Secretary of State Antony Blinken’s visit to Beijing failed to provide any major positives. The same should keep the Gold pair sellers hopeful.
Previously, sentiment soured after the People’s Bank of China (PBoC) cut two key lending rates (Loan Prime Rate (LPR) and Medium-term Landing Facility (MLF) rate for the first time in almost a year.
Additionally, hawkish comments from the Fed Officials and upbeat US data also weigh on the Gold Price. On Tuesday, Fed governor and Vice Chair Nominee Philip Jefferson said, “I remain focused on returning it to our 2% target.” On the same line, Federal Reserve Governor Lisa Cook said “I am committed to promoting sustained economic growth in a context of low and stable inflation,” in her statement to be given before the Senate on Wednesday. Further, Fed Board nominee Adriana Kugler also mentioned, per the prepared statements for Wednesday’s Testimony, that returning inflation to the central bank’s 2% target is key to setting a strong foundation for the US economy.
Apart from the hawkish Federal Reserve (Fed) comments, upbeat United States (US) data also favored the Gold sellers. That said, US Housing Starts jumped to the highest level since April 2022 by rising 21.7% MoM in May versus -2.9% (revised from +2.2%) recorded in April and -0.8% market forecasts. On the same line, Building Permits were also upbeat for the said month, up 5.2% MoM versus -5.0% expected and -1.4% previous readings (revised from -1.5%).
Against this backdrop, the Wall Street benchmark began the week on the negative side while the US Treasury bond yields also snapped a two-day winning streak.
Looking ahead, a light calendar ahead of Fed Chair Jerome Powell’s bi-annual Testimony can keep the Gold traders on a dicey floor.
A daily closing below the 100-DMA flags the Gold Price downside as traders await this week’s key event, namely Federal Reserve Chairman Jerome Powell’s bi-annual Testimony.
It’s worth noting, however, that the Relative Strength Index (RSI) line is below 50.0 and the Moving Average Convergence and Divergence (MACD) indicator also flashes sluggish signals, which in turn suggests that the Gold Price has limited room toward the south.
This highlights a convergence of the 38.2% Fibonacci retracement level of the XAU/USD’s run-up from November 2022 to May 2023 and an ascending support line from late 2022, near $1,903, quickly followed by the $1,900 round figure.
In a case where the Gold price fails to rebound from the $1,900 threshold, the odds of witnessing a slump towards the 50% and 61.8% Fibonacci retracements, respectively near $1,948 and $1,793 can’t be ruled out.
Meanwhile, Gold Price recovery remains elusive unless the bulls manage to cross the 50-DMA hurdle of around $1,983.
That said, the 100-DMA and 23.6% Fibonacci retracement level, close to $1,942 and $1,972 in that order, guard short-term rebound of the XAU/USD price.
To sum up, the Gold Price lures bears with the 100-DMA breakdown but the road towards the south appears long and bumpy.
Trend: Further downside expected
Technical Levels: Supports and Resistances
XAUUSD currently trading at 1937.84 at the time of writing. Pair opened at 1936.4 and is trading with a change of 0.07% % .
| Overview | Overview.1 | |
|---|---|---|
| 0 | Today last price | 1937.84 |
| 1 | Today Daily Change | 1.44 |
| 2 | Today Daily Change % | 0.07% |
| 3 | Today daily open | 1936.4 |
The pair is trading below its 20 Daily moving average @ 1953.76, below its 50 Daily moving average @ 1983.15 , below its 100 Daily moving average @ 1942.45 and above its 200 Daily moving average @ 1849.86
| Trends | Trends.1 | |
|---|---|---|
| 0 | Daily SMA20 | 1953.76 |
| 1 | Daily SMA50 | 1983.15 |
| 2 | Daily SMA100 | 1942.45 |
| 3 | Daily SMA200 | 1849.86 |
The previous day high was 1956.86 while the previous day low was 1929.82. The daily 38.2% Fib levels comes at 1940.15, expected to provide resistance. Similarly, the daily 61.8% fib level is at 1946.53, expected to provide resistance.
Note the levels of interest below:
- Pivot support is noted at 1925.19, 1913.99, 1898.15
- Pivot resistance is noted at 1952.23, 1968.07, 1979.27
| Levels | Levels.1 |
|---|---|
| Previous Daily High | 1956.86 |
| Previous Daily Low | 1929.82 |
| Previous Weekly High | 1971.01 |
| Previous Weekly Low | 1924.85 |
| Previous Monthly High | 2079.76 |
| Previous Monthly Low | 1932.12 |
| Daily Fibonacci 38.2% | 1940.15 |
| Daily Fibonacci 61.8% | 1946.53 |
| Daily Pivot Point S1 | 1925.19 |
| Daily Pivot Point S2 | 1913.99 |
| Daily Pivot Point S3 | 1898.15 |
| Daily Pivot Point R1 | 1952.23 |
| Daily Pivot Point R2 | 1968.07 |
| Daily Pivot Point R3 | 1979.27 |
[/s2If]
Nehcap Expert Advisor
The NEHCAP MT4 EA is high quality professional trading system geared to generate returns without using GRID or martingales. Each trade has strict risk per trade parameter. The pairs under management include EURUSD, GBPUSD, AUDCAD, AUDNZD,GBPAUD, EURAUD, EURCAD, CHFJPY and many more.
The system is trading live: LIVE ACCOUNT TRACKING
You can run it free. Apply for a free trial and track our account. Buy the system or use profit share mechanism to generate returns on your MT4.
Join Our Telegram Group
")


