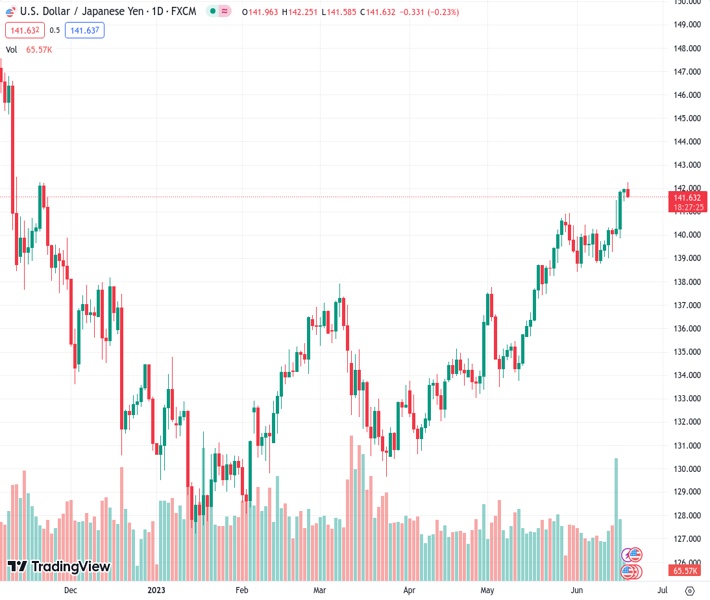
USDJPY retraces from its highest level seen since November 2022, but still shows a four-day increasing trend despite recently struggling at the top.
…
This is a premium post.
[s2If !current_user_can(access_s2member_level4)]Please register for FREE REGISTER to read full post below containing analysis. In case of any error or you think you are not able to read the full post below, please email us at support#nehcap.com [lwa][/s2If] [s2If current_user_can(access_s2member_level1)]
- USD/JPY retreats from the highest level since November 2022, print four-day uptrend despite grinding at multi-day top of late.
The pair currently trades last at 141.636.
The previous day high was 142.0 while the previous day low was 141.44. The daily 38.2% Fib levels comes at 141.79, expected to provide resistance. Similarly, the daily 61.8% fib level is at 141.66, expected to provide resistance.
USD/JPY pares intraday gains at the seven-month high amid early Tuesday, falling from a multi-day peak of 142.25 to 142.00 by the press time. That said, the Yen pair previously cheered the US Dollar run-up and an upbeat start of the week by the Treasury bond yields to refresh the yearly top before retreating on the mixed catalysts.
That said, the US Dollar Index (DXY) prints a three-day uptrend near 102.60 by the press time even as the US Treasury bond yields struggle to defend the latest run-up. That said, the US 10-year and two-year Treasury bond yields grind near 3.82% and 4.75% respectively by the press time, after rising in the last two consecutive days.
It’s worth noting that the yield began the trading week on a firmer footing amid hawkish hopes from the Fed and fears of more US-China jitters. However, the People’s Bank of China’s (PBoC) rate cut and Japan Finance Minister (FinMin) Shunichi Suzuki’s comments appear to prod the market sentiment, US Treasury bond yields and the USD/JPY prices of late.
That said, the PBoC matches market expectations of announcing 10 basis points (bps) rate cut to propel the growth amid concerns that the world’s biggest industrial player is losing recovery.
On the other hand, Japan FinMin Suzuki said earlier in the day that FX should move stably reflecting the fundamentals. The policymaker refrained from commenting on the FX levels but highlighted the importance of stability in the market. It’s worth noting that Japan’s Industry Minister Nishimura also advocates for stability in the FX markets.
Elsewhere, the Fed monetary policy reports to the US Congress and the latest comments from the Fed officials have been hawkish and favor the US Dollar bulls. That said, the Fed policy report for Congress said, “Inflation in the US is well above target and the labor market remains very tight,” as per Reuters. Among the Fed talkers, Richmond Fed President Thomas Barkin, Chicago Fed President Austan Goolsbee and Federal Reserve Governor Christopher Waller were the important ones who appeared a bit hawkish of late.
It should be noted that the US Secretary of State Antony Blinken met China President Xi Jinping and Beijing’s top diplomat Wang Yi and raised hopes of an easing in the US-China ties. However, concerns about Taiwan keep challenging the route for cordial relations.
Amid these plays, S&P500 Futures print mild losses whereas the yields grind higher.
Moving on, USD/JPY is likely to remain firmer but the second-tier US housing data, Japan Industrial Production for April and Fed versus BoJ updates will be the key to watch for the clear directions.
A seven-week-old rising trend channel keeps USD/JPY pair buyers hopeful until it trades between 140.20 and 143.70.
Technical Levels: Supports and Resistances
USDJPY currently trading at 142.11 at the time of writing. Pair opened at 141.97 and is trading with a change of 0.10% % .
| Overview | Overview.1 | |
|---|---|---|
| 0 | Today last price | 142.11 |
| 1 | Today Daily Change | 0.14 |
| 2 | Today Daily Change % | 0.10% |
| 3 | Today daily open | 141.97 |
The pair remains strongly bullish on the daily timeframe. It trades above its 20 SMA @ 139.94, 50 SMA 137.07, 100 SMA @ 135.13 and 200 SMA @ 137.23.
| Trends | Trends.1 | |
|---|---|---|
| 0 | Daily SMA20 | 139.94 |
| 1 | Daily SMA50 | 137.07 |
| 2 | Daily SMA100 | 135.13 |
| 3 | Daily SMA200 | 137.23 |
The previous day high was 142.0 while the previous day low was 141.44. The daily 38.2% Fib levels comes at 141.79, expected to provide resistance. Similarly, the daily 61.8% fib level is at 141.66, expected to provide resistance.
Note the levels of interest below:
- Pivot support is noted at 141.61, 141.24, 141.05
- Pivot resistance is noted at 142.17, 142.37, 142.73
| Levels | Levels.1 |
|---|---|
| Previous Daily High | 142.00 |
| Previous Daily Low | 141.44 |
| Previous Weekly High | 141.92 |
| Previous Weekly Low | 139.01 |
| Previous Monthly High | 140.93 |
| Previous Monthly Low | 133.50 |
| Daily Fibonacci 38.2% | 141.79 |
| Daily Fibonacci 61.8% | 141.66 |
| Daily Pivot Point S1 | 141.61 |
| Daily Pivot Point S2 | 141.24 |
| Daily Pivot Point S3 | 141.05 |
| Daily Pivot Point R1 | 142.17 |
| Daily Pivot Point R2 | 142.37 |
| Daily Pivot Point R3 | 142.73 |
[/s2If]
Nehcap Expert Advisor
The NEHCAP MT4 EA is high quality professional trading system geared to generate returns without using GRID or martingales. Each trade has strict risk per trade parameter. The pairs under management include EURUSD, GBPUSD, AUDCAD, AUDNZD,GBPAUD, EURAUD, EURCAD, CHFJPY and many more.
The system is trading live: LIVE ACCOUNT TRACKING
You can run it free. Apply for a free trial and track our account. Buy the system or use profit share mechanism to generate returns on your MT4.
Join Our Telegram Group
")


