The XAUUSD currently stands at $1,932.42 following a significant drop in value attributed to the stronger USD. Market traders are paying close attention to any details provided in Fed Chair Powell’s testimony.
…
This is a premium post.
[s2If !current_user_can(access_s2member_level4)]Please register for FREE REGISTER to read full post below containing analysis. In case of any error or you think you are not able to read the full post below, please email us at support#nehcap.com [lwa][/s2If] [s2If current_user_can(access_s2member_level1)]
- XAU/USD trades at $1932.42 after a sharp fall due to a stronger USD, with traders watching for Fed Chair Powell’s testimony.
The pair currently trades last at 1934.31.
The previous day high was 1958.85 while the previous day low was 1947.86. The daily 38.2% Fib levels comes at 1952.06, expected to provide resistance. Similarly, the daily 61.8% fib level is at 1954.65, expected to provide resistance.
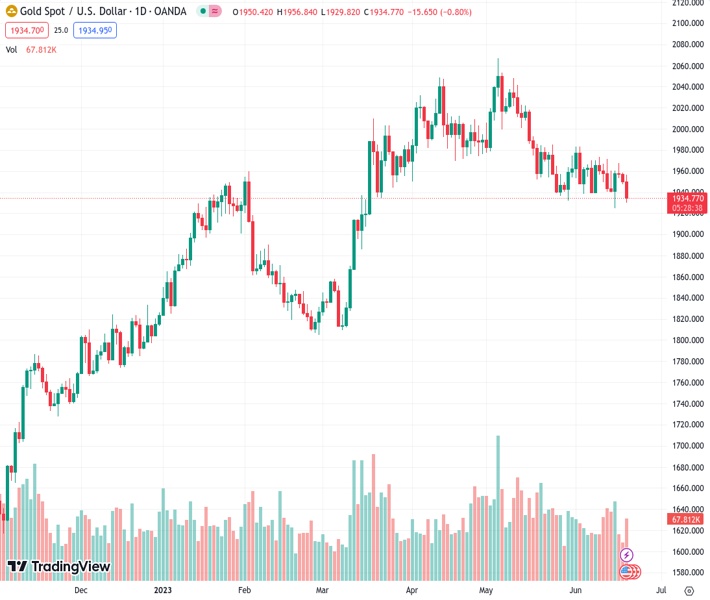
Gold price tumbled sharply in the North American session as trading resumed after a holiday in the United States (US). A stronger US Dollar (USD) is the main reason behind XAU/USD’s fall, as the US Treasury bond yield slid, with traders eyeing Federal Reserve (Fed) Chair Jerome Powell’s testimony at the US Congress. At the time of writing, XAU/USD is trading at $1932.42 after hitting a daily high of $1956.74.
US equities continue to trade negatively. The US 10-year benchmark note dropped more than ten basis points at 3.707%, a tailwind for Gold prices, which remained downward pressured. Even though the CME FedWatch Tool shows, traders expect a 25 bps increase at the July Federal Reserve Open Market Committee (FOMC) meeting. It should be said that despite Federal Reserve officials forecasting 50 bps increases to the Federal Funds Rate (FFR), market participants are not, as shown by CME data.
In the meantime, US State Secretary Anthony Blinken reunited with Chinese President Xi Jinping to improve ties between but countries. Still, they failed to get an agreement on better military communication. Expectations for growth in China have been revised downward as the People’s Bank of China (PboC) has cut rates three times in the last ten days, aiming to stimulate the economy.
Aside from this, Fed Chair Jerome Powell will appear at the US Congress on Wednesday and Thursday. Traders expect the Chair to keep his press conference tone, but any hawkish surprises can bolster the US Dollar, and weaken Gold, as it would underpin US Treasury bond yields higher. However, any dovish signals and the greenback would be punished by market participants.
On the data front, US housing starts soaring to a 13-month high, up 21.7% MoM in May, crushing April’s -2.9% contraction, while Building Permits rose by 5.2%, exceeding last month’s -1.4% plunge.
The US economic docket would be busy with Fed officials crossing the wires, led by Fed Chair Powell. Initial Jobless Claims and Existing Home Sales will be featured on Thursday.
XAU/USD resumed its downward path after breaking a descending symmetrical triangle, breaking dynamic support at the 100-day Exponential Moving Average (EMA) at $1939.56. Immediate support lies at $1925.06, June 15 swing low, ahead of nosediving toward $1900. Of note, oscillators warrant further downside, as the Relative Strength Index (RSI) indicator portrays sellers in charge, while the three-day Rate of Change (RoC) shifted gears to the downside after back-to-back positive sessions. Conversely, if XAU/USD reclaims $1950, that could cap XAU/USD’s losses, but a break above the 20-day EMA, at $1957.13, could offer additional support to the yellow metal.
Technical Levels: Supports and Resistances
XAUUSD currently trading at 1935.77 at the time of writing. Pair opened at 1950.05 and is trading with a change of -0.73 % .
| Overview | Overview.1 | |
|---|---|---|
| 0 | Today last price | 1935.77 |
| 1 | Today Daily Change | -14.28 |
| 2 | Today Daily Change % | -0.73 |
| 3 | Today daily open | 1950.05 |
The pair is trading below its 20 Daily moving average @ 1955.7, below its 50 Daily moving average @ 1984.5 , below its 100 Daily moving average @ 1942.31 and above its 200 Daily moving average @ 1848.8
| Trends | Trends.1 | |
|---|---|---|
| 0 | Daily SMA20 | 1955.70 |
| 1 | Daily SMA50 | 1984.50 |
| 2 | Daily SMA100 | 1942.31 |
| 3 | Daily SMA200 | 1848.80 |
The previous day high was 1958.85 while the previous day low was 1947.86. The daily 38.2% Fib levels comes at 1952.06, expected to provide resistance. Similarly, the daily 61.8% fib level is at 1954.65, expected to provide resistance.
Note the levels of interest below:
- Pivot support is noted at 1945.66, 1941.26, 1934.67
- Pivot resistance is noted at 1956.65, 1963.24, 1967.64
| Levels | Levels.1 |
|---|---|
| Previous Daily High | 1958.85 |
| Previous Daily Low | 1947.86 |
| Previous Weekly High | 1971.01 |
| Previous Weekly Low | 1924.85 |
| Previous Monthly High | 2079.76 |
| Previous Monthly Low | 1932.12 |
| Daily Fibonacci 38.2% | 1952.06 |
| Daily Fibonacci 61.8% | 1954.65 |
| Daily Pivot Point S1 | 1945.66 |
| Daily Pivot Point S2 | 1941.26 |
| Daily Pivot Point S3 | 1934.67 |
| Daily Pivot Point R1 | 1956.65 |
| Daily Pivot Point R2 | 1963.24 |
| Daily Pivot Point R3 | 1967.64 |
[/s2If]
Nehcap Expert Advisor
The NEHCAP MT4 EA is high quality professional trading system geared to generate returns without using GRID or martingales. Each trade has strict risk per trade parameter. The pairs under management include EURUSD, GBPUSD, AUDCAD, AUDNZD,GBPAUD, EURAUD, EURCAD, CHFJPY and many more.
The system is trading live: LIVE ACCOUNT TRACKING
You can run it free. Apply for a free trial and track our account. Buy the system or use profit share mechanism to generate returns on your MT4.
Join Our Telegram Group
")


