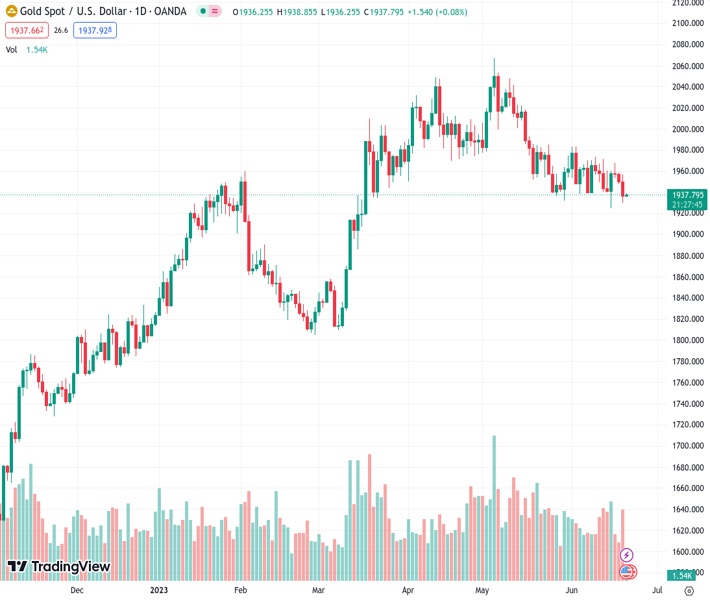
The XAUUSD, currently at 1,937.74, has experienced a decrease of over 0.70% and is now confronting the monthly low of $1,925.
…
This is a premium post.
[s2If !current_user_can(access_s2member_level4)]Please register for FREE REGISTER to read full post below containing analysis. In case of any error or you think you are not able to read the full post below, please email us at support#nehcap.com [lwa][/s2If] [s2If current_user_can(access_s2member_level1)]
- XAU/USD lost more than 0.70% and challenges the $1,925 monthly low.
The pair currently trades last at 1937.74.
The previous day high was 1958.85 while the previous day low was 1947.86. The daily 38.2% Fib levels comes at 1952.06, expected to provide resistance. Similarly, the daily 61.8% fib level is at 1954.65, expected to provide resistance.
The yellow metal traded with losses on Tuesday’s session, heading towards the $1,935 area despite a sour market mood following the People’s Bank’s of China (PBoC) rate cuts which fueled global economic downturn fears. In that sense, the US bond yields weakened across the board, but the US Dollar managed to hold its ground and hence weakened the XAU/USD pair.
During the Asian trading session, the People’s Bank of China took a significant step by announcing a reduction in the benchmark Loan Prime Rates (LPRs) by ten basis points (bps). Moreover, the one-year LPR was cut from 3.65% to 3.55%, while the five-year LPR was lowered from 4.30% to 4.20%. These rate cuts served as a reminder to investors about the sluggishness observed in Chinese economic activity and fueled global economic downturn fears..
As a result, the US bond yields, which could be seen as the opportunity cost of holding Gold, lost ground. The 10-year bond yield retraced to 3.72%, the 2-year yield closed at 4.69% while the 5-year at 3.95%, all three with more than 1% declines.
Elsewhere, the US stock market weakened on Tuesday, as all three major indices closed in negative territory. The S&P 500 index (SPX) saw a 0.47% loss, the Dow Jones Industrial Average (DJI) a 0.72% loss, and the Nasdaq Composite (NDX) a 0.09% decline.
Investors are now shifting their focus to Jerome Powell’s testimony before Congress during Wednesday’s session, as they seek any hints or indications regarding the Federal Reserve’s monetary policy next steps.
Technically speaking, the XAU/USD maintains a bearish outlook for the short term, as per indicators on the daily chart. The Relative Strength Index (RSI) and Moving Average Convergence Divergence (MACD) are both showing weakness, standing in negative territory. In addition, the price now trades below the 20- and 100-day Simple Moving Average (SMA) with both of them about to perform a bearish cross.
The monthly low at $1,925 level stands as a key support level. If broken, the $1,915 area and psychological mark at $1,900 could come into play. Furthermore, a move above the 100-day SMA at $1,942 would suggest a continuation of the bullish trend for the yellow metal, with next resistances at the 20-day SMA at $1,953 and the $1,975 zone.
Technical Levels: Supports and Resistances
XAUUSD currently trading at 1937.91 at the time of writing. Pair opened at 1950.05 and is trading with a change of -0.62 % .
| Overview | Overview.1 | |
|---|---|---|
| 0 | Today last price | 1937.91 |
| 1 | Today Daily Change | -12.14 |
| 2 | Today Daily Change % | -0.62 |
| 3 | Today daily open | 1950.05 |
The pair is trading below its 20 Daily moving average @ 1955.7, below its 50 Daily moving average @ 1984.5 , below its 100 Daily moving average @ 1942.31 and above its 200 Daily moving average @ 1848.8
| Trends | Trends.1 | |
|---|---|---|
| 0 | Daily SMA20 | 1955.70 |
| 1 | Daily SMA50 | 1984.50 |
| 2 | Daily SMA100 | 1942.31 |
| 3 | Daily SMA200 | 1848.80 |
The previous day high was 1958.85 while the previous day low was 1947.86. The daily 38.2% Fib levels comes at 1952.06, expected to provide resistance. Similarly, the daily 61.8% fib level is at 1954.65, expected to provide resistance.
Note the levels of interest below:
- Pivot support is noted at 1945.66, 1941.26, 1934.67
- Pivot resistance is noted at 1956.65, 1963.24, 1967.64
| Levels | Levels.1 |
|---|---|
| Previous Daily High | 1958.85 |
| Previous Daily Low | 1947.86 |
| Previous Weekly High | 1971.01 |
| Previous Weekly Low | 1924.85 |
| Previous Monthly High | 2079.76 |
| Previous Monthly Low | 1932.12 |
| Daily Fibonacci 38.2% | 1952.06 |
| Daily Fibonacci 61.8% | 1954.65 |
| Daily Pivot Point S1 | 1945.66 |
| Daily Pivot Point S2 | 1941.26 |
| Daily Pivot Point S3 | 1934.67 |
| Daily Pivot Point R1 | 1956.65 |
| Daily Pivot Point R2 | 1963.24 |
| Daily Pivot Point R3 | 1967.64 |
[/s2If]
Nehcap Expert Advisor
The NEHCAP MT4 EA is high quality professional trading system geared to generate returns without using GRID or martingales. Each trade has strict risk per trade parameter. The pairs under management include EURUSD, GBPUSD, AUDCAD, AUDNZD,GBPAUD, EURAUD, EURCAD, CHFJPY and many more.
The system is trading live: LIVE ACCOUNT TRACKING
You can run it free. Apply for a free trial and track our account. Buy the system or use profit share mechanism to generate returns on your MT4.
Join Our Telegram Group
")


