The USDMXN at a rate of 17.0961 is still finding it difficult to make progress and remains close to its lowest level in several years.
…
This is a premium post.
[s2If !current_user_can(access_s2member_level4)]Please register for FREE REGISTER to read full post below containing analysis. In case of any error or you think you are not able to read the full post below, please email us at support#nehcap.com [lwa][/s2If] [s2If current_user_can(access_s2member_level1)]
- USD/MXN continues with its struggle to gain any traction and languishes near a multi-year low.
The pair currently trades last at 17.0961.
The previous day high was 17.1724 while the previous day low was 17.061. The daily 38.2% Fib levels comes at 17.1299, expected to provide resistance. Similarly, the daily 61.8% fib level is at 17.1036, expected to provide resistance.
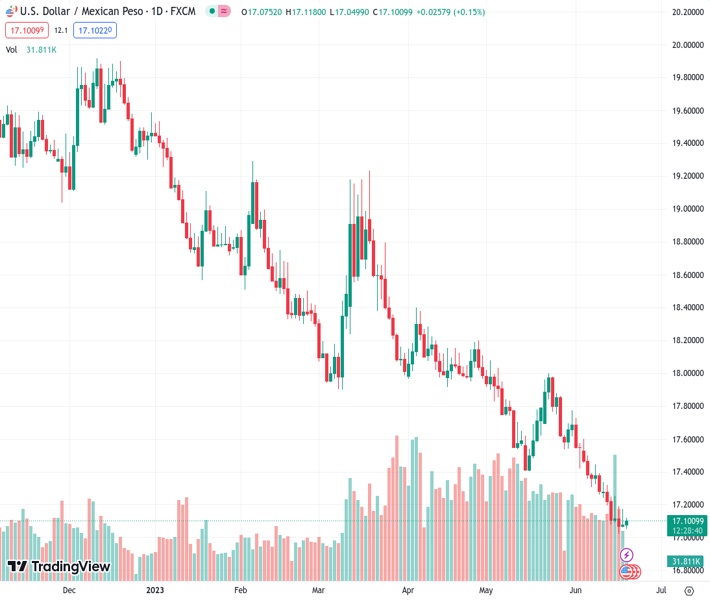
The USD/MXN pair struggles to capitalize on the previous day’s modest rebound from the 17.0245 area, or its lowest level since December 2015 and oscillates in a narrow range through the early part of the European session on Tuesday. The pair currently trades just below the 17.1000 round figure, nearly unchanged for the day, and seems vulnerable to sliding further.
From a technical perspective, the recent downfall from the vicinity of the 18.00 round-figure mark, or the May swing high, has been along a downward-sloping channel. This points to a well-established short-term bearish trend and suggests that the path of least resistance for the USD/MXN pair is to the downside. That said, the Relative Strength Index (RSI) on the daily chart is still flashing oversold conditions and holding back traders from placing fresh bearish bets around the pair.
Nevertheless, the lack of any meaningful buying suggests that the downtrend is still far from being over. Hence, any recovery attempt could attract fresh sellers near the 17.20-17.25 area, which coincides with the 50-period Simple Moving Average (SMA) on the 4-hour chart. This is closely followed by the top end of the aforementioned channel and should act as a pivotal point. A convincing breakout will suggest that the USD/MXN pair has formed a bottom and pave the way for additional gains.
On the flip side, the multi-year low, around the 17.0245-17.0240 zone could protect the immediate downside ahead of the trend-channel support, currently pegged just below the 17.0000 psychological mark. Some follow-through selling will be seen as a fresh trigger for bearish traders and make the USD/MXN pair vulnerable to accelerate the fall towards the 16.60-16.55 region en route to the November 2015 swing low, around the 16.35 region.
Technical Levels: Supports and Resistances
USDMXN currently trading at 17.0883 at the time of writing. Pair opened at 17.0804 and is trading with a change of 0.05 % .
| Overview | Overview.1 | |
|---|---|---|
| 0 | Today last price | 17.0883 |
| 1 | Today Daily Change | 0.0079 |
| 2 | Today Daily Change % | 0.0500 |
| 3 | Today daily open | 17.0804 |
The pair remains strongly bearish on the daily time frame. It trades below the 20 SMA @ 17.4535, 50 SMA 17.7094, 100 SMA @ 18.0832 and 200 SMA @ 18.8332.
| Trends | Trends.1 | |
|---|---|---|
| 0 | Daily SMA20 | 17.4535 |
| 1 | Daily SMA50 | 17.7094 |
| 2 | Daily SMA100 | 18.0832 |
| 3 | Daily SMA200 | 18.8332 |
The previous day high was 17.1724 while the previous day low was 17.061. The daily 38.2% Fib levels comes at 17.1299, expected to provide resistance. Similarly, the daily 61.8% fib level is at 17.1036, expected to provide resistance.
Note the levels of interest below:
- Pivot support is noted at 17.0368, 16.9932, 16.9255
- Pivot resistance is noted at 17.1482, 17.216, 17.2596
| Levels | Levels.1 |
|---|---|
| Previous Daily High | 17.1724 |
| Previous Daily Low | 17.0610 |
| Previous Weekly High | 17.3353 |
| Previous Weekly Low | 17.0243 |
| Previous Monthly High | 18.0780 |
| Previous Monthly Low | 17.4203 |
| Daily Fibonacci 38.2% | 17.1299 |
| Daily Fibonacci 61.8% | 17.1036 |
| Daily Pivot Point S1 | 17.0368 |
| Daily Pivot Point S2 | 16.9932 |
| Daily Pivot Point S3 | 16.9255 |
| Daily Pivot Point R1 | 17.1482 |
| Daily Pivot Point R2 | 17.2160 |
| Daily Pivot Point R3 | 17.2596 |
[/s2If]
Nehcap Expert Advisor
The NEHCAP MT4 EA is high quality professional trading system geared to generate returns without using GRID or martingales. Each trade has strict risk per trade parameter. The pairs under management include EURUSD, GBPUSD, AUDCAD, AUDNZD,GBPAUD, EURAUD, EURCAD, CHFJPY and many more.
The system is trading live: LIVE ACCOUNT TRACKING
You can run it free. Apply for a free trial and track our account. Buy the system or use profit share mechanism to generate returns on your MT4.
Join Our Telegram Group
")


