The USDINR, currently trading at 82.1225, has received increased demand and is expected to continue its upward movement along a seven-month trend line. Nehcap predicts a continued recovery in the near future.
…
This is a premium post.
[s2If !current_user_can(access_s2member_level4)]Please register for FREE REGISTER to read full post below containing analysis. In case of any error or you think you are not able to read the full post below, please email us at support#nehcap.com [lwa][/s2If] [s2If current_user_can(access_s2member_level1)]
- USD/INR picks up bids to extend bounce of seven-month-old ascending support line.
The pair currently trades last at 82.1225.
The previous day high was 82.0048 while the previous day low was 81.8895. The daily 38.2% Fib levels comes at 81.9608, expected to provide support. Similarly, the daily 61.8% fib level is at 81.9335, expected to provide support.
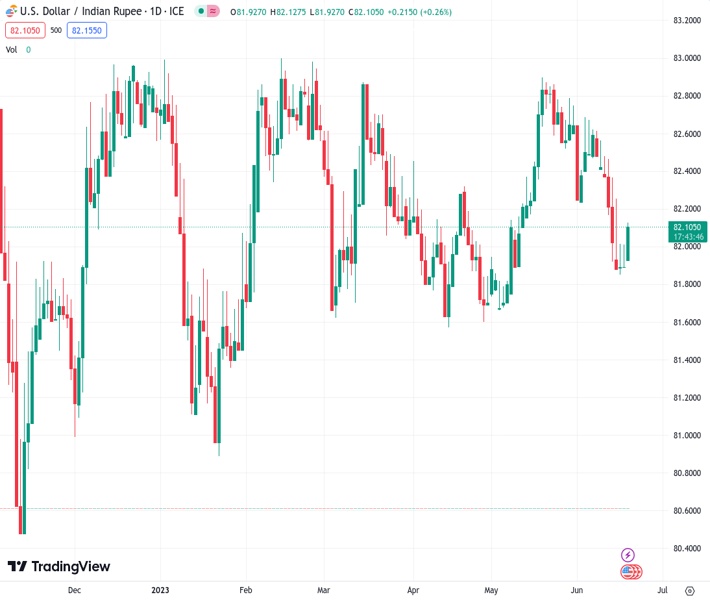
USD/INR renews its intraday high near 82.10 as it prints a three-day uptrend while bouncing off the key support line amid early Tuesday in Europe.
The Indian Rupee (INR) pair’s recovery also takes clues from the RSI (14) line as it improves toward the 50.0 level of late.
However, the bearish MACD signals require the USD/INR pair buyers to wait for a daily closing beyond the 200-DMA hurdle of around 82.10 to retake control. Even so, the 100-DMA resistance of near 82.30 will act as an extra filter toward the north.
Above all, a symmetrical triangle formation established since October 2022 restricts USD/INR moves between 82.00 and 82.80 of late.
That said, the pair’s latest rebound from the support line will please short-term buyers before making them jostle with the 82.80 key hurdle, a break of which could quickly propel the USD/INR price beyond the 83.00 round figure.
On the flip side, a daily closing below the 82.00 support will make the pair vulnerable to refreshing the yearly low, currently around 80.90. In doing so, April’s bottom of around 81.50 may act as a buffer.
Trend: Further recovery expected
Technical Levels: Supports and Resistances
USDINR currently trading at 82.0919 at the time of writing. Pair opened at 81.983 and is trading with a change of 0.13% % .
| Overview | Overview.1 | |
|---|---|---|
| 0 | Today last price | 82.0919 |
| 1 | Today Daily Change | 0.1089 |
| 2 | Today Daily Change % | 0.13% |
| 3 | Today daily open | 81.983 |
The pair is trading below its 20 Daily moving average @ 82.4306, below its 50 Daily moving average @ 82.2059 , below its 100 Daily moving average @ 82.2879 and above its 200 Daily moving average @ 82.0636
| Trends | Trends.1 | |
|---|---|---|
| 0 | Daily SMA20 | 82.4306 |
| 1 | Daily SMA50 | 82.2059 |
| 2 | Daily SMA100 | 82.2879 |
| 3 | Daily SMA200 | 82.0636 |
The previous day high was 82.0048 while the previous day low was 81.8895. The daily 38.2% Fib levels comes at 81.9608, expected to provide support. Similarly, the daily 61.8% fib level is at 81.9335, expected to provide support.
Note the levels of interest below:
- Pivot support is noted at 81.9134, 81.8438, 81.7981
- Pivot resistance is noted at 82.0287, 82.0744, 82.144
| Levels | Levels.1 |
|---|---|
| Previous Daily High | 82.0048 |
| Previous Daily Low | 81.8895 |
| Previous Weekly High | 82.5680 |
| Previous Weekly Low | 81.8477 |
| Previous Monthly High | 82.9810 |
| Previous Monthly Low | 81.6435 |
| Daily Fibonacci 38.2% | 81.9608 |
| Daily Fibonacci 61.8% | 81.9335 |
| Daily Pivot Point S1 | 81.9134 |
| Daily Pivot Point S2 | 81.8438 |
| Daily Pivot Point S3 | 81.7981 |
| Daily Pivot Point R1 | 82.0287 |
| Daily Pivot Point R2 | 82.0744 |
| Daily Pivot Point R3 | 82.1440 |
[/s2If]
Nehcap Expert Advisor
The NEHCAP MT4 EA is high quality professional trading system geared to generate returns without using GRID or martingales. Each trade has strict risk per trade parameter. The pairs under management include EURUSD, GBPUSD, AUDCAD, AUDNZD,GBPAUD, EURAUD, EURCAD, CHFJPY and many more.
The system is trading live: LIVE ACCOUNT TRACKING
You can run it free. Apply for a free trial and track our account. Buy the system or use profit share mechanism to generate returns on your MT4.
Join Our Telegram Group
")


