The USDCHF pair is facing difficulty in continuing Friday’s rebound, but it maintains modest gains during the three-day upward trend. According to @nehcap, there is an anticipated additional increase.
…
This is a premium post.
[s2If !current_user_can(access_s2member_level4)]Please register for FREE REGISTER to read full post below containing analysis. In case of any error or you think you are not able to read the full post below, please email us at support#nehcap.com [lwa][/s2If] [s2If current_user_can(access_s2member_level1)]
- USD/CHF struggles to extend Friday’s recovery, clings to mild gains during three-day uptrend.
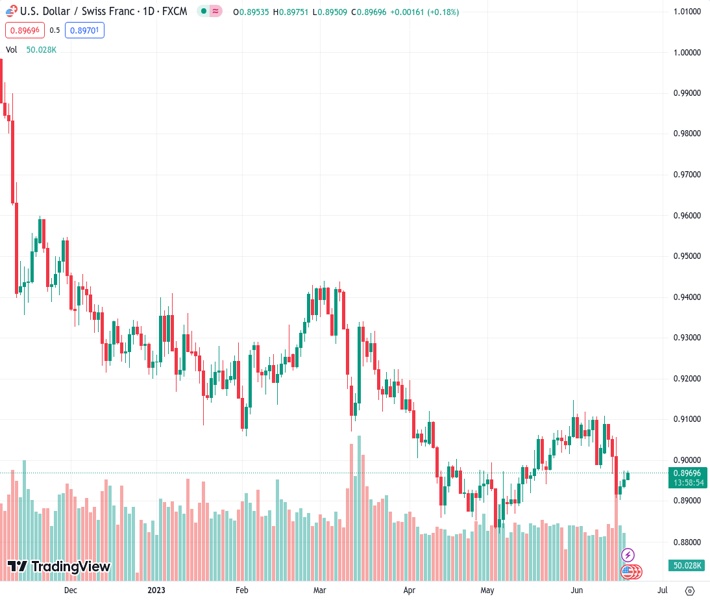
The pair currently trades last at 0.89670.
The previous day high was 0.8975 while the previous day low was 0.8934. The daily 38.2% Fib levels comes at 0.8959, expected to provide support. Similarly, the daily 61.8% fib level is at 0.8949, expected to provide support.
USD/CHF reverses intraday gains as it fades bounce off an ascending support line from Friday heading into Tuesday’s European session, downbeat around 0.8960 by the press time. In doing so, the Swiss Franc (CHF) pair fails to defend the three-day recovery from the lowest level in five weeks.
The pullback moves, however, lack acceptance from the RSI and MACD oscillators as the former remains steady near the 50.0 level whereas the latter prints bullish signals.
Hence, the USD/CHF is likely to remain firmer past the immediate support line, close to 0.8955 at the latest.
Even if the quote breaks the nearby support line, the 61.8% Fibonacci retracement level of its May 04-31 upside, near 0.8945, will act as an extra filter toward the south.
It’s worth noting, however, that the USD/CHF pair’s weakness past 0.8945 won’t hesitate in refreshing the monthly low, currently around the 0.8900 round figure.
In that case, the previous monthly low of 0.8820, also the lowest level since early 2021, will be in the spotlight.
On the contrary, a one-week-old falling resistance line, around 0.8990 and the 0.9000 psychological magnet guard the immediate recovery of the USD/CHF pair.
Following that, the 200-SMA level of around 0.8975 acts as the final defense of the bears, a break of which will quickly cross the 0.9000 round figure ahead of directing the pair buyers toward the June 12 swing high of near 0.9110.
Trend: Further upside expected
Technical Levels: Supports and Resistances
USDCHF currently trading at 0.8964 at the time of writing. Pair opened at 0.8959 and is trading with a change of 0.06% % .
| Overview | Overview.1 | |
|---|---|---|
| 0 | Today last price | 0.8964 |
| 1 | Today Daily Change | 0.0005 |
| 2 | Today Daily Change % | 0.06% |
| 3 | Today daily open | 0.8959 |
The pair remains strongly bearish on the daily time frame. It trades below the 20 SMA @ 0.9038, 50 SMA 0.898, 100 SMA @ 0.9106 and 200 SMA @ 0.9337.
| Trends | Trends.1 | |
|---|---|---|
| 0 | Daily SMA20 | 0.9038 |
| 1 | Daily SMA50 | 0.8980 |
| 2 | Daily SMA100 | 0.9106 |
| 3 | Daily SMA200 | 0.9337 |
The previous day high was 0.8975 while the previous day low was 0.8934. The daily 38.2% Fib levels comes at 0.8959, expected to provide support. Similarly, the daily 61.8% fib level is at 0.8949, expected to provide support.
Note the levels of interest below:
- Pivot support is noted at 0.8937, 0.8914, 0.8895
- Pivot resistance is noted at 0.8978, 0.8997, 0.9019
| Levels | Levels.1 |
|---|---|
| Previous Daily High | 0.8975 |
| Previous Daily Low | 0.8934 |
| Previous Weekly High | 0.9109 |
| Previous Weekly Low | 0.8902 |
| Previous Monthly High | 0.9148 |
| Previous Monthly Low | 0.8820 |
| Daily Fibonacci 38.2% | 0.8959 |
| Daily Fibonacci 61.8% | 0.8949 |
| Daily Pivot Point S1 | 0.8937 |
| Daily Pivot Point S2 | 0.8914 |
| Daily Pivot Point S3 | 0.8895 |
| Daily Pivot Point R1 | 0.8978 |
| Daily Pivot Point R2 | 0.8997 |
| Daily Pivot Point R3 | 0.9019 |
[/s2If]
Nehcap Expert Advisor
The NEHCAP MT4 EA is high quality professional trading system geared to generate returns without using GRID or martingales. Each trade has strict risk per trade parameter. The pairs under management include EURUSD, GBPUSD, AUDCAD, AUDNZD,GBPAUD, EURAUD, EURCAD, CHFJPY and many more.
The system is trading live: LIVE ACCOUNT TRACKING
You can run it free. Apply for a free trial and track our account. Buy the system or use profit share mechanism to generate returns on your MT4.
Join Our Telegram Group
")


