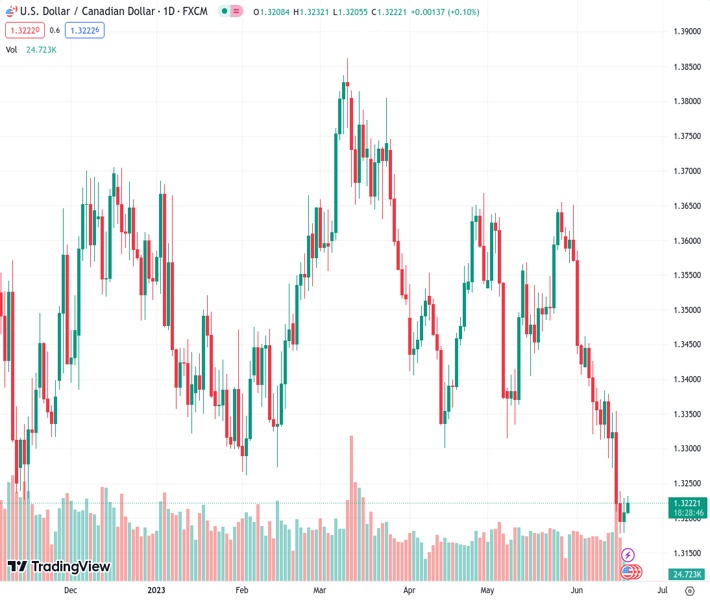
The USDCAD price at 1.32250 is experiencing consecutive upward movement for the second day in a row and is gradually rebounding from the lowest point reached this year.
…
This is a premium post.
[s2If !current_user_can(access_s2member_level4)]Please register for FREE REGISTER to read full post below containing analysis. In case of any error or you think you are not able to read the full post below, please email us at support#nehcap.com [lwa][/s2If] [s2If current_user_can(access_s2member_level1)]
- USD/CAD gains traction for the second straight day and recovers further from the YTD low.
The pair currently trades last at 1.32250.
The previous day high was 1.3229 while the previous day low was 1.3179. The daily 38.2% Fib levels comes at 1.321, expected to provide support. Similarly, the daily 61.8% fib level is at 1.3198, expected to provide support.
The USD/CAD pair builds on the previous day’s modest recovery from its lowest level since September 2022 and gains positive traction for the second successive day on Tuesday. Spot prices maintain the bid tone through the Asian session and currently trade around the 1.3225-1.3230 region, up 0.15% for the day.
Crude Oil prices remain depressed in the wake of worries that a global economic slowdown, particularly in China, will dent fuel demand. This, in turn, undermines the commodity-linked Loonie, which, along with a modest US Dollar (USD) strength, acts as a tailwind for the USD/CAD pair. It is worth recalling that the recent Chinese macro data showed that the world’s second-largest economy is struggling to sustain the momentum seen earlier this year.
Even reports that China is considering a broad stimulus package to bolster economic support and the expected move by the People’s Bank of China (PBoC), to cut one-year and five-year Loan Prime Rates (LPRs), fail to ease market concerns. This is evident from a weaker risk tone, which, along with a goodish pickup in the US Treasury bond yields, pushes the safe-haven USD higher for the third straight day and lends support to the USD/CAD pair.
The Federal Reserve (Fed), though skipped a rate hike last week, signalled that borrowing costs may still need to rise by as much as 50 bps by the end of this year. The markets were quick to react and are now pricing in another 25 bps lift-off at the July FOMC meeting, which, in turn, triggers a fresh leg up in the US bond yields. That said, the incoming softer US economic data raised questions over how much headroom the Fed has to keep raising rates.
Hence, the market focus now shifts to Fed Chair Jerome Powell’s congressional testimony on Wednesday and Thursday, which will be scrutinized for fresh clues about the future rate-hike path. This, in turn, will play a key role in determining the near-term trajectory for the USD and provide some meaningful impetus to the USD/CAD pair. In the meantime, Oil price dynamics should allow traders to grab short-term opportunities around the major.
Technical Levels: Supports and Resistances
USDCAD currently trading at 1.323 at the time of writing. Pair opened at 1.321 and is trading with a change of 0.15 % .
| Overview | Overview.1 | |
|---|---|---|
| 0 | Today last price | 1.323 |
| 1 | Today Daily Change | 0.002 |
| 2 | Today Daily Change % | 0.150 |
| 3 | Today daily open | 1.321 |
The pair remains strongly bearish on the daily time frame. It trades below the 20 SMA @ 1.3428, 50 SMA 1.3463, 100 SMA @ 1.351 and 200 SMA @ 1.352.
| Trends | Trends.1 | |
|---|---|---|
| 0 | Daily SMA20 | 1.3428 |
| 1 | Daily SMA50 | 1.3463 |
| 2 | Daily SMA100 | 1.3510 |
| 3 | Daily SMA200 | 1.3520 |
The previous day high was 1.3229 while the previous day low was 1.3179. The daily 38.2% Fib levels comes at 1.321, expected to provide support. Similarly, the daily 61.8% fib level is at 1.3198, expected to provide support.
Note the levels of interest below:
- Pivot support is noted at 1.3183, 1.3156, 1.3133
- Pivot resistance is noted at 1.3233, 1.3256, 1.3282
| Levels | Levels.1 |
|---|---|
| Previous Daily High | 1.3229 |
| Previous Daily Low | 1.3179 |
| Previous Weekly High | 1.3384 |
| Previous Weekly Low | 1.3178 |
| Previous Monthly High | 1.3655 |
| Previous Monthly Low | 1.3315 |
| Daily Fibonacci 38.2% | 1.3210 |
| Daily Fibonacci 61.8% | 1.3198 |
| Daily Pivot Point S1 | 1.3183 |
| Daily Pivot Point S2 | 1.3156 |
| Daily Pivot Point S3 | 1.3133 |
| Daily Pivot Point R1 | 1.3233 |
| Daily Pivot Point R2 | 1.3256 |
| Daily Pivot Point R3 | 1.3282 |
[/s2If]
Nehcap Expert Advisor
The NEHCAP MT4 EA is high quality professional trading system geared to generate returns without using GRID or martingales. Each trade has strict risk per trade parameter. The pairs under management include EURUSD, GBPUSD, AUDCAD, AUDNZD,GBPAUD, EURAUD, EURCAD, CHFJPY and many more.
The system is trading live: LIVE ACCOUNT TRACKING
You can run it free. Apply for a free trial and track our account. Buy the system or use profit share mechanism to generate returns on your MT4.
Join Our Telegram Group
")


