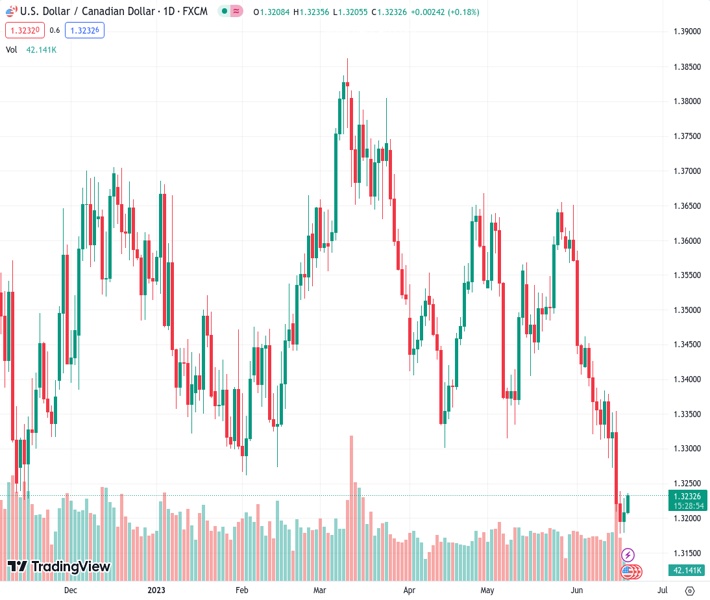
The USDCAD has continued to recover from its yearly low, reaching a new intraday high. However, it is not anticipated to rise significantly further according to the opinion of the analyst Nehcap.
…
This is a premium post.
[s2If !current_user_can(access_s2member_level4)]Please register for FREE REGISTER to read full post below containing analysis. In case of any error or you think you are not able to read the full post below, please email us at support#nehcap.com [lwa][/s2If] [s2If current_user_can(access_s2member_level1)]
- USD/CAD extends week-start rebound from yearly low, renews intraday top of late.
The pair currently trades last at 1.32328.
The previous day high was 1.3229 while the previous day low was 1.3179. The daily 38.2% Fib levels comes at 1.321, expected to provide support. Similarly, the daily 61.8% fib level is at 1.3198, expected to provide support.
USD/CAD refreshes intraday high near 1.3235 as it extends the previous day’s rebound from the nine-month low heading into Tuesday’s European session.
In doing so, the Loonie pair justifies the triangle breakout, as well as the bullish MACD signals.
However, a joint of the 100-Hour Moving Average (HMA) and previous support line stretched from June 07, around 1.3250, appears a short-term key hurdle for the Loonie pair buyers.
Should the quote manage to cross the 1.3250 resistance confluence, the 200-HMA level of around 1.3300 will act as the final defense of the USD/CAD bears before giving control to the bulls.
In that case, the mid-June swing high of around 1.3385 and the monthly peak of 1.3585 will be in the spotlight.
On the contrary, the top line of the immediate triangle puts a floor under the USD/CAD price near 1.3215.
Following that, the stated triangle’s bottom low and the latest trough, respectively near 1.3200 and 1.3175, will challenge the USD/CAD sellers ahead of directing them to the September 2022 bottom of around 1.2955.
Trend: Limited upside expected
Technical Levels: Supports and Resistances
USDCAD currently trading at 1.3232 at the time of writing. Pair opened at 1.321 and is trading with a change of 0.17% % .
| Overview | Overview.1 | |
|---|---|---|
| 0 | Today last price | 1.3232 |
| 1 | Today Daily Change | 0.0022 |
| 2 | Today Daily Change % | 0.17% |
| 3 | Today daily open | 1.321 |
The pair remains strongly bearish on the daily time frame. It trades below the 20 SMA @ 1.3428, 50 SMA 1.3463, 100 SMA @ 1.351 and 200 SMA @ 1.352.
| Trends | Trends.1 | |
|---|---|---|
| 0 | Daily SMA20 | 1.3428 |
| 1 | Daily SMA50 | 1.3463 |
| 2 | Daily SMA100 | 1.3510 |
| 3 | Daily SMA200 | 1.3520 |
The previous day high was 1.3229 while the previous day low was 1.3179. The daily 38.2% Fib levels comes at 1.321, expected to provide support. Similarly, the daily 61.8% fib level is at 1.3198, expected to provide support.
Note the levels of interest below:
- Pivot support is noted at 1.3183, 1.3156, 1.3133
- Pivot resistance is noted at 1.3233, 1.3256, 1.3282
| Levels | Levels.1 |
|---|---|
| Previous Daily High | 1.3229 |
| Previous Daily Low | 1.3179 |
| Previous Weekly High | 1.3384 |
| Previous Weekly Low | 1.3178 |
| Previous Monthly High | 1.3655 |
| Previous Monthly Low | 1.3315 |
| Daily Fibonacci 38.2% | 1.3210 |
| Daily Fibonacci 61.8% | 1.3198 |
| Daily Pivot Point S1 | 1.3183 |
| Daily Pivot Point S2 | 1.3156 |
| Daily Pivot Point S3 | 1.3133 |
| Daily Pivot Point R1 | 1.3233 |
| Daily Pivot Point R2 | 1.3256 |
| Daily Pivot Point R3 | 1.3282 |
[/s2If]
Nehcap Expert Advisor
The NEHCAP MT4 EA is high quality professional trading system geared to generate returns without using GRID or martingales. Each trade has strict risk per trade parameter. The pairs under management include EURUSD, GBPUSD, AUDCAD, AUDNZD,GBPAUD, EURAUD, EURCAD, CHFJPY and many more.
The system is trading live: LIVE ACCOUNT TRACKING
You can run it free. Apply for a free trial and track our account. Buy the system or use profit share mechanism to generate returns on your MT4.
Join Our Telegram Group
")


