The USDCAD at 1.32342 is exhibiting a lack of strong movement, resembling the trend of the stationary USD Index and petroleum costs.
…
This is a premium post.
[s2If !current_user_can(access_s2member_level4)]Please register for FREE REGISTER to read full post below containing analysis. In case of any error or you think you are not able to read the full post below, please email us at support#nehcap.com [lwa][/s2If] [s2If current_user_can(access_s2member_level1)]
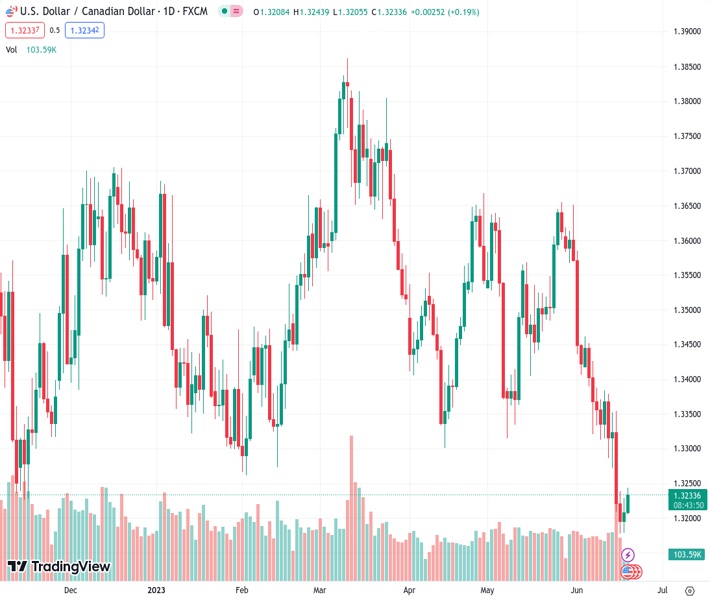
- USD/CAD is showing lackluster action following the footprints of the sideways USD Index and oil prices.
The pair currently trades last at 1.32342.
The previous day high was 1.3229 while the previous day low was 1.3179. The daily 38.2% Fib levels comes at 1.321, expected to provide support. Similarly, the daily 61.8% fib level is at 1.3198, expected to provide support.
The USD/CAD pair is demonstrating topsy-turvy moves above the round-level support of 1.3200 in the London session. The Loonie asset is showing lackluster action following the footprints of the sideways US Dollar Index (DXY) and oil prices.
S&P500 futures have recovered some of the losses but caution prevails as the US opening session is expected to remain volatile. Investors are expected to wind up their positions after an extended weekend, which might create sheer volatility.
The US Dollar Index (DXY) is hovering around 102.48 as investors are keeping an eye over the Federal Reserve (Fed) chair Jerome Powell’s testimony. Interest rate guidance and a detailed explanation behind a skip in the policy-tightening regime will be keenly watched.
Meanwhile, the Canadian Dollar will dance to the tunes of the Retail Sales data (April). Monthly Retail Sales data is seen expanding by 0.2% against a contraction of 1.4% witnessed earlier. Economic data excluding automobile numbers is seen expanding by 0.4%. This indicates that demand for automobiles have remained weak as higher inflationary pressures are biting the income of households. Also, individuals are postponing demand for automobiles to avoid higher installment obligations due to elevated interest rates by the Bank of Canada (BoC).
On the oil front, the upside in the oil price seems restricted above $72.00 despite a rate cut by the People’s Bank of China (PBoC). China’s central bank cuts its benchmark Loan Prime Rates (LPRs) by 10 basis points (bps) due to which the one-year LPR was reduced from 3.65% to 3.55% while the five-year LPR was trimmed to 4.20%. The higher monetary stimulus might accelerate oil demand ahead.
It is worth noting that China is the largest importer of oil in the world and expansionary PBoC monetary policy would support the oil price ahead.
Technical Levels: Supports and Resistances
USDCAD currently trading at 1.3233 at the time of writing. Pair opened at 1.321 and is trading with a change of 0.17 % .
| Overview | Overview.1 | |
|---|---|---|
| 0 | Today last price | 1.3233 |
| 1 | Today Daily Change | 0.0023 |
| 2 | Today Daily Change % | 0.1700 |
| 3 | Today daily open | 1.3210 |
The pair remains strongly bearish on the daily time frame. It trades below the 20 SMA @ 1.3428, 50 SMA 1.3463, 100 SMA @ 1.351 and 200 SMA @ 1.352.
| Trends | Trends.1 | |
|---|---|---|
| 0 | Daily SMA20 | 1.3428 |
| 1 | Daily SMA50 | 1.3463 |
| 2 | Daily SMA100 | 1.3510 |
| 3 | Daily SMA200 | 1.3520 |
The previous day high was 1.3229 while the previous day low was 1.3179. The daily 38.2% Fib levels comes at 1.321, expected to provide support. Similarly, the daily 61.8% fib level is at 1.3198, expected to provide support.
Note the levels of interest below:
- Pivot support is noted at 1.3183, 1.3156, 1.3133
- Pivot resistance is noted at 1.3233, 1.3256, 1.3282
| Levels | Levels.1 |
|---|---|
| Previous Daily High | 1.3229 |
| Previous Daily Low | 1.3179 |
| Previous Weekly High | 1.3384 |
| Previous Weekly Low | 1.3178 |
| Previous Monthly High | 1.3655 |
| Previous Monthly Low | 1.3315 |
| Daily Fibonacci 38.2% | 1.3210 |
| Daily Fibonacci 61.8% | 1.3198 |
| Daily Pivot Point S1 | 1.3183 |
| Daily Pivot Point S2 | 1.3156 |
| Daily Pivot Point S3 | 1.3133 |
| Daily Pivot Point R1 | 1.3233 |
| Daily Pivot Point R2 | 1.3256 |
| Daily Pivot Point R3 | 1.3282 |
[/s2If]
Nehcap Expert Advisor
The NEHCAP MT4 EA is high quality professional trading system geared to generate returns without using GRID or martingales. Each trade has strict risk per trade parameter. The pairs under management include EURUSD, GBPUSD, AUDCAD, AUDNZD,GBPAUD, EURAUD, EURCAD, CHFJPY and many more.
The system is trading live: LIVE ACCOUNT TRACKING
You can run it free. Apply for a free trial and track our account. Buy the system or use profit share mechanism to generate returns on your MT4.
Join Our Telegram Group
")


