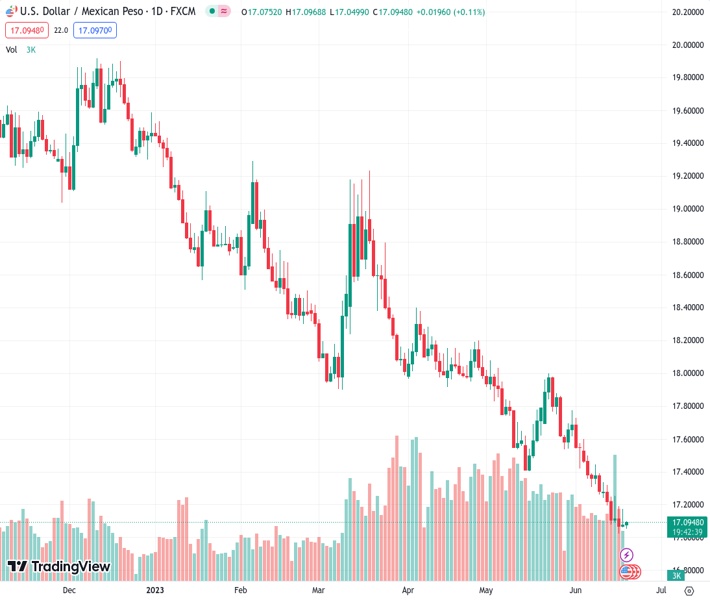
The US dollar against the Mexican peso, with a value of 17.0909, has gained buyers and continued to recover from the lows seen in December 2015. However, experts predict that this recovery will be limited.
…
This is a premium post.
[s2If !current_user_can(access_s2member_level4)]Please register for FREE REGISTER to read full post below containing analysis. In case of any error or you think you are not able to read the full post below, please email us at support#nehcap.com [lwa][/s2If] [s2If current_user_can(access_s2member_level1)]
- USD/MXN picks up bids to extend the previous day’s recovery from December 2015 lows.
The pair currently trades last at 17.0909.
The previous day high was 17.1724 while the previous day low was 17.061. The daily 38.2% Fib levels comes at 17.1299, expected to provide resistance. Similarly, the daily 61.8% fib level is at 17.1036, expected to provide resistance.
USD/MXN remains on the front foot, clings to mild gains of late, as it pierces the 17.00 round figure during early Tuesday in Asia, up 0.07% on a day near 17.10 by the press time.
In doing so, the Mexican Peso (MXN) pair extends the previous day’s recovery from the lowest levels since December 2015 amid steady RSI (14) and sluggish MACD signals.
Although the oscillators suggest a continuation of the corrective bounce, the USD/MXN pair’s downside break of an upward-sloping support line from Friday, now immediate resistance near 17.12, prods the bulls.
Even if the Mexican Peso (MXN) pair rises past 17.12, a convergence of the 100-Hour Moving Average (HMA) and descending resistance line from June 08, close to 17.14, appears a tough nut to crack for the short-term USD/MXN buyers.
Following that, the quote may approach the previous monthly low of around 17.42 which holds the key for the USD/MXN bull run.
Meanwhile, the 17.00 psychological magnet puts a floor under the USD/MXN price, a break of which could direct the MXN buyers toward the mid-December 2015 low of around 16.89.
It’s worth noting that the multiple levels marked in 2015 together highlight 16.40-38 zone as the key support to watch for the USD/MXN bears past 16.89.
Overall, the USD/MXN pair is likely to remain bearish but a short-term recovery can’t be ruled out in a case where it manages to cross the 17.14 resistance confluence.
Trend: Limited recovery expected
Technical Levels: Supports and Resistances
USDMXN currently trading at 17.0903 at the time of writing. Pair opened at 17.0804 and is trading with a change of 0.06% % .
| Overview | Overview.1 | |
|---|---|---|
| 0 | Today last price | 17.0903 |
| 1 | Today Daily Change | 0.0099 |
| 2 | Today Daily Change % | 0.06% |
| 3 | Today daily open | 17.0804 |
The pair remains strongly bearish on the daily time frame. It trades below the 20 SMA @ 17.4535, 50 SMA 17.7094, 100 SMA @ 18.0832 and 200 SMA @ 18.8332.
| Trends | Trends.1 | |
|---|---|---|
| 0 | Daily SMA20 | 17.4535 |
| 1 | Daily SMA50 | 17.7094 |
| 2 | Daily SMA100 | 18.0832 |
| 3 | Daily SMA200 | 18.8332 |
The previous day high was 17.1724 while the previous day low was 17.061. The daily 38.2% Fib levels comes at 17.1299, expected to provide resistance. Similarly, the daily 61.8% fib level is at 17.1036, expected to provide resistance.
Note the levels of interest below:
- Pivot support is noted at 17.0368, 16.9932, 16.9255
- Pivot resistance is noted at 17.1482, 17.216, 17.2596
| Levels | Levels.1 |
|---|---|
| Previous Daily High | 17.1724 |
| Previous Daily Low | 17.0610 |
| Previous Weekly High | 17.3353 |
| Previous Weekly Low | 17.0243 |
| Previous Monthly High | 18.0780 |
| Previous Monthly Low | 17.4203 |
| Daily Fibonacci 38.2% | 17.1299 |
| Daily Fibonacci 61.8% | 17.1036 |
| Daily Pivot Point S1 | 17.0368 |
| Daily Pivot Point S2 | 16.9932 |
| Daily Pivot Point S3 | 16.9255 |
| Daily Pivot Point R1 | 17.1482 |
| Daily Pivot Point R2 | 17.2160 |
| Daily Pivot Point R3 | 17.2596 |
[/s2If]
Nehcap Expert Advisor
The NEHCAP MT4 EA is high quality professional trading system geared to generate returns without using GRID or martingales. Each trade has strict risk per trade parameter. The pairs under management include EURUSD, GBPUSD, AUDCAD, AUDNZD,GBPAUD, EURAUD, EURCAD, CHFJPY and many more.
The system is trading live: LIVE ACCOUNT TRACKING
You can run it free. Apply for a free trial and track our account. Buy the system or use profit share mechanism to generate returns on your MT4.
Join Our Telegram Group
")


