The price of gold, represented by #XAUUSD, has remained steady above $1,950.00 due to the lackluster performance of the USD Index.
…
This is a premium post.
[s2If !current_user_can(access_s2member_level4)]Please register for FREE REGISTER to read full post below containing analysis. In case of any error or you think you are not able to read the full post below, please email us at support#nehcap.com [lwa][/s2If] [s2If current_user_can(access_s2member_level1)]
- Gold price has stabilized above $1,950.00 amid subdued performance by the USD Index.
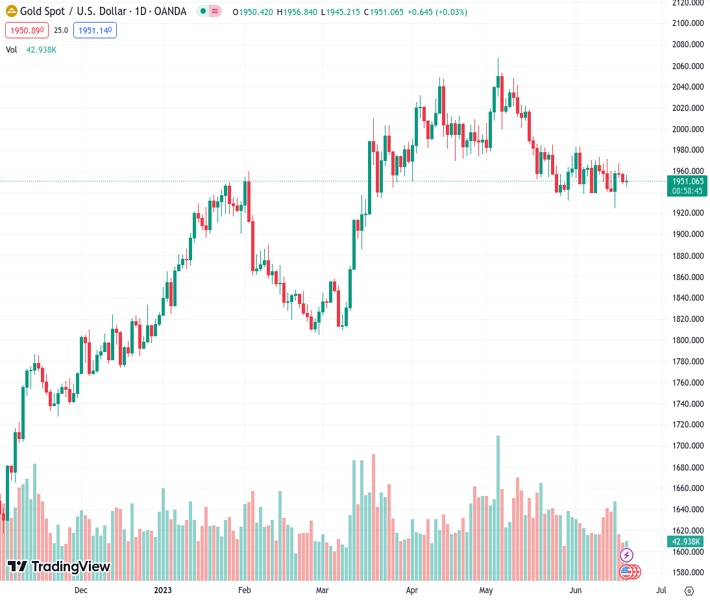
The pair currently trades last at 1951.23.
The previous day high was 1958.85 while the previous day low was 1947.86. The daily 38.2% Fib levels comes at 1952.06, expected to provide resistance. Similarly, the daily 61.8% fib level is at 1954.65, expected to provide resistance.
Gold price (XAU/USD) is holding itself above the crucial support of $1,950.00 as the US Dollar Index (DXY) is demonstrating a subdued performance in the European session. The precious metal is broadly showing a non-directional performance as investors lack clarity about further action ahead of testimony from Federal Reserve (Fed) chair Jerome Powell’s testimony.
S&P500 futures have trimmed some losses posted in Europe. Investors are going light into the American session as US markets will open after an extended weekend. The US Dollar Index (DXY) is inside the woods around 102.44 as the testimony of Fed Powell will provide clear guidance about interest rates. The US Treasury yields have come under pressure as investors are expecting that only one interest rate hike is left in the basket of the Fed.
In the monetary policy statement, Fed Powell confirmed that the central bank will hike interest rates two times by the year-end. Also, rate cuts are not appropriate as US Employment situation has not softened yet. The US economy is operating at full employment levels and firms are facing higher payouts to retain talent. Apart from the tight labor market conditions, Fed policymakers believe that tight credit conditions by the US regional banks would keep a lid on inflationary pressures.
Gold price is auctioning in a Descending Triangle chart pattern on a two-hour scale that indicates a volatility contraction. Downward-sloping trendline of the aforementioned chart pattern is plotted from June 02 high at $1,983.00 while its horizontal support is placed from May 30 low at $1,932.12.
The 200-period Exponential Moving Average (EMA) at $1,958.84 is acting as a barricade for the Gold bulls. Horizontal resistance is plotted from May 05 low around $2,000.00.
The Relative Strength Index (RSI) (14) is oscillating in the 40.00-60.00 range, which indicates a non-directional performance.
Technical Levels: Supports and Resistances
XAUUSD currently trading at 1951.81 at the time of writing. Pair opened at 1950.05 and is trading with a change of 0.09 % .
| Overview | Overview.1 | |
|---|---|---|
| 0 | Today last price | 1951.81 |
| 1 | Today Daily Change | 1.76 |
| 2 | Today Daily Change % | 0.09 |
| 3 | Today daily open | 1950.05 |
The pair is trading below its 20 Daily moving average @ 1955.7, below its 50 Daily moving average @ 1984.5 , above its 100 Daily moving average @ 1942.31 and above its 200 Daily moving average @ 1848.8
| Trends | Trends.1 | |
|---|---|---|
| 0 | Daily SMA20 | 1955.70 |
| 1 | Daily SMA50 | 1984.50 |
| 2 | Daily SMA100 | 1942.31 |
| 3 | Daily SMA200 | 1848.80 |
The previous day high was 1958.85 while the previous day low was 1947.86. The daily 38.2% Fib levels comes at 1952.06, expected to provide resistance. Similarly, the daily 61.8% fib level is at 1954.65, expected to provide resistance.
Note the levels of interest below:
- Pivot support is noted at 1945.66, 1941.26, 1934.67
- Pivot resistance is noted at 1956.65, 1963.24, 1967.64
| Levels | Levels.1 |
|---|---|
| Previous Daily High | 1958.85 |
| Previous Daily Low | 1947.86 |
| Previous Weekly High | 1971.01 |
| Previous Weekly Low | 1924.85 |
| Previous Monthly High | 2079.76 |
| Previous Monthly Low | 1932.12 |
| Daily Fibonacci 38.2% | 1952.06 |
| Daily Fibonacci 61.8% | 1954.65 |
| Daily Pivot Point S1 | 1945.66 |
| Daily Pivot Point S2 | 1941.26 |
| Daily Pivot Point S3 | 1934.67 |
| Daily Pivot Point R1 | 1956.65 |
| Daily Pivot Point R2 | 1963.24 |
| Daily Pivot Point R3 | 1967.64 |
[/s2If]
Nehcap Expert Advisor
The NEHCAP MT4 EA is high quality professional trading system geared to generate returns without using GRID or martingales. Each trade has strict risk per trade parameter. The pairs under management include EURUSD, GBPUSD, AUDCAD, AUDNZD,GBPAUD, EURAUD, EURCAD, CHFJPY and many more.
The system is trading live: LIVE ACCOUNT TRACKING
You can run it free. Apply for a free trial and track our account. Buy the system or use profit share mechanism to generate returns on your MT4.
Join Our Telegram Group
")


