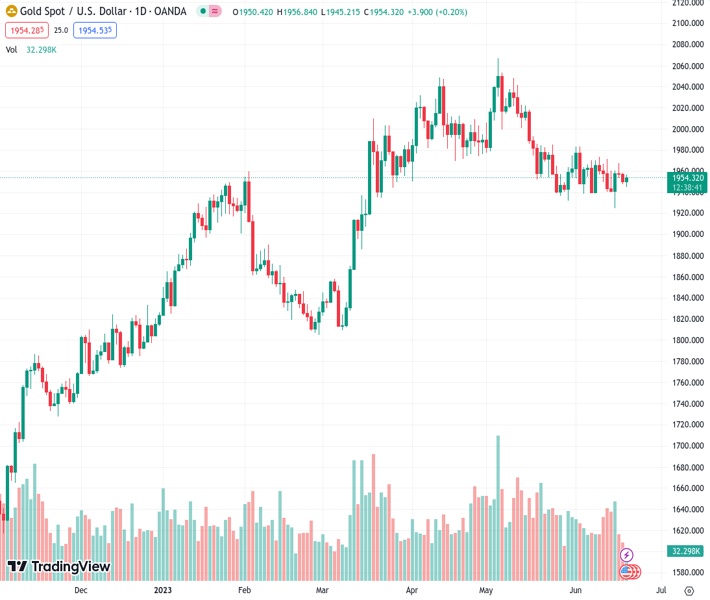
The price of gold, listed as XAUUSD at $1,954.31, has risen above the resistance level of $1,950.00 due to the struggle of the USD Index to continue its recovery.
…
This is a premium post.
[s2If !current_user_can(access_s2member_level4)]Please register for FREE REGISTER to read full post below containing analysis. In case of any error or you think you are not able to read the full post below, please email us at support#nehcap.com [lwa][/s2If] [s2If current_user_can(access_s2member_level1)]
- Gold price has jumped above the $1,950.00 resistance as the USD Index is struggling in extending its recovery.
The pair currently trades last at 1954.31.
The previous day high was 1958.85 while the previous day low was 1947.86. The daily 38.2% Fib levels comes at 1952.06, expected to provide support. Similarly, the daily 61.8% fib level is at 1954.65, expected to provide resistance.
Gold price (XAU/USD) witnessed decent buying interest around $1,947.50 in the London session. The precious metal has climbed above the crucial resistance of $1,950.00 as investors are anticipating only one more interest rate hike from the Federal Reserve (Fed) this year.
S&P500 futures have extended their downside journey as investors have the excuse of an extended weekend in the United States due to Juneteenth. Investors’ risk-taking ability has dropped and the appeal for risk-perceived assets has softened.
Economists at HSBC believe that investors should prepare for some consolidation as valuations have risen, and the potential of further Fed tightening may cut into future earnings estimates and valuations in the short term. However, we feel the Fed is closer to the end of its monetary policy tightening cycle, and this should bode well for US equities.
The US Dollar Index (DXY) has turned sideways as the upside is restricted around 102.60 despite Fed chair Jerome Powell having confirmed that no rate cuts are appropriate this year. In spite of rising weekly jobless claims three times in a row, a jump in the Unemployment Rate to 3.8%, and softening of consumer and producer inflationary pressures due to lower gasoline prices, the Fed believes that core inflation is still persistent and labor market conditions have not softened enough to announce victory over the sticky Consumer Price Index (CPI).
Gold price is marching toward the upper portion of the Falling Wedge chart pattern, which indicates a consistent downside move followed by an upside breakout. The 200-period Exponential Moving Average (EMA) at $1,958.84 is acting as a barricade for the Gold bulls. Horizontal resistance is plotted from May 05 low around $2,000.00.
The Relative Strength Index (RSI) (14) is oscillating in the 40.00-60.00 range, which indicates a non-directional performance.
Technical Levels: Supports and Resistances
XAUUSD currently trading at 1953.19 at the time of writing. Pair opened at 1950.05 and is trading with a change of 0.16 % .
| Overview | Overview.1 | |
|---|---|---|
| 0 | Today last price | 1953.19 |
| 1 | Today Daily Change | 3.14 |
| 2 | Today Daily Change % | 0.16 |
| 3 | Today daily open | 1950.05 |
The pair is trading below its 20 Daily moving average @ 1955.7, below its 50 Daily moving average @ 1984.5 , above its 100 Daily moving average @ 1942.31 and above its 200 Daily moving average @ 1848.8
| Trends | Trends.1 | |
|---|---|---|
| 0 | Daily SMA20 | 1955.70 |
| 1 | Daily SMA50 | 1984.50 |
| 2 | Daily SMA100 | 1942.31 |
| 3 | Daily SMA200 | 1848.80 |
The previous day high was 1958.85 while the previous day low was 1947.86. The daily 38.2% Fib levels comes at 1952.06, expected to provide support. Similarly, the daily 61.8% fib level is at 1954.65, expected to provide resistance.
Note the levels of interest below:
- Pivot support is noted at 1945.66, 1941.26, 1934.67
- Pivot resistance is noted at 1956.65, 1963.24, 1967.64
| Levels | Levels.1 |
|---|---|
| Previous Daily High | 1958.85 |
| Previous Daily Low | 1947.86 |
| Previous Weekly High | 1971.01 |
| Previous Weekly Low | 1924.85 |
| Previous Monthly High | 2079.76 |
| Previous Monthly Low | 1932.12 |
| Daily Fibonacci 38.2% | 1952.06 |
| Daily Fibonacci 61.8% | 1954.65 |
| Daily Pivot Point S1 | 1945.66 |
| Daily Pivot Point S2 | 1941.26 |
| Daily Pivot Point S3 | 1934.67 |
| Daily Pivot Point R1 | 1956.65 |
| Daily Pivot Point R2 | 1963.24 |
| Daily Pivot Point R3 | 1967.64 |
[/s2If]
Nehcap Expert Advisor
The NEHCAP MT4 EA is high quality professional trading system geared to generate returns without using GRID or martingales. Each trade has strict risk per trade parameter. The pairs under management include EURUSD, GBPUSD, AUDCAD, AUDNZD,GBPAUD, EURAUD, EURCAD, CHFJPY and many more.
The system is trading live: LIVE ACCOUNT TRACKING
You can run it free. Apply for a free trial and track our account. Buy the system or use profit share mechanism to generate returns on your MT4.
Join Our Telegram Group
")


