The GBPUSD, trading at 1.27636, has temporarily stopped its bounce-back from a one-week low due to a two-day losing streak as the UK inflation data approaches. According to @nehcap, there is a probability of further decline.
…
This is a premium post.
[s2If !current_user_can(access_s2member_level4)]Please register for FREE REGISTER to read full post below containing analysis. In case of any error or you think you are not able to read the full post below, please email us at support#nehcap.com [lwa][/s2If] [s2If current_user_can(access_s2member_level1)]
- GBP/USD pauses corrective bounce off one-week low after two-day losing streak as UK inflation data looms.
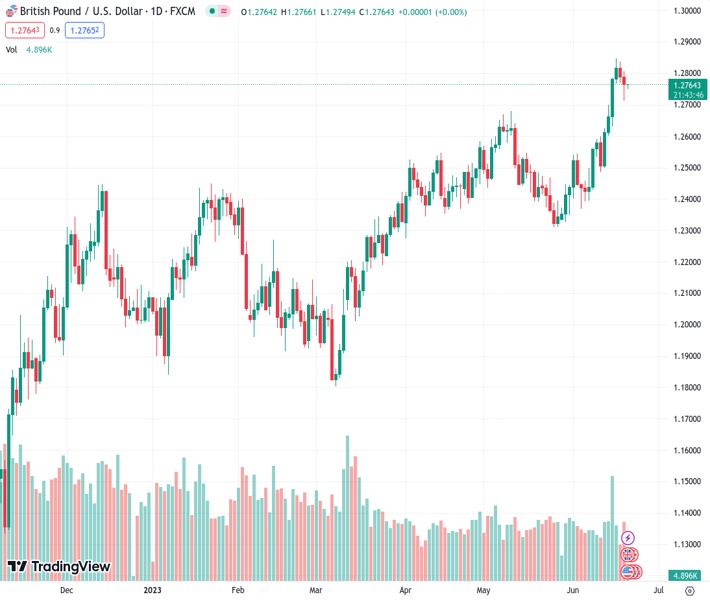
The pair currently trades last at 1.27636.
The previous day high was 1.2837 while the previous day low was 1.277. The daily 38.2% Fib levels comes at 1.2796, expected to provide resistance. Similarly, the daily 61.8% fib level is at 1.2812, expected to provide resistance.
GBP/USD fades corrective bounce off weekly low as it retreats to 1.2760 amid the early hours of Wednesday’s Asian session, sidelined of late. In doing so, the Cable pair inability to defend the previous week’s upside break of a five-month-old resistance line amid the overbought RSI conditions. It’s worth noting that the Pound Sterling’s latest inaction could be linked to the market’s cautious mood ahead of the UK’s top-tier inflation clues including the Consumer Price Index (CPI) for May.
Also read: GBP/USD retraces below 1.2800 on a strong USD, ahead of Powell testimony, BoE’s decision
Given the overbought RSI (14) line and the Cable pair’s inability to stay beyond the key resistance line, the GBP/USD bears are well-set to extend the previous two-day downtrend. However, the previous monthly high join the 10-DMA to highlight the 1.2685-80 region as the short-term key support zone for them to conquer to tighten the grip.
Also acting as a short-term downside filter is an upward-sloping trend line from June 05, close to 1.2645 by the press time.
In a case where the GBP/USD pair breaks the 1.2645 support, the early June swing high of near 1.2545 will precede a 3.5-month-old ascending support line, close to 1.2475, to please the bears before directing them to the January 2023 peak of near 1.2450.
On the contrary, GBP/USD recovery needs to cross the latest monthly peak of around 1.2850 to aim for the early April 2022 low of near 1.2975-80.
Following that, the 1.3000 psychological magnet may act as an extra check for the Pound Sterling bulls before giving them control.
Trend: Further downside expected
Technical Levels: Supports and Resistances
GBPUSD currently trading at 1.2764 at the time of writing. Pair opened at 1.2792 and is trading with a change of -0.22 % .
| Overview | Overview.1 | |
|---|---|---|
| 0 | Today last price | 1.2764 |
| 1 | Today Daily Change | -0.0028 |
| 2 | Today Daily Change % | -0.2200 |
| 3 | Today daily open | 1.2792 |
The pair remains strongly bullish on the daily timeframe. It trades above its 20 SMA @ 1.2513, 50 SMA 1.25, 100 SMA @ 1.2328 and 200 SMA @ 1.2051.
| Trends | Trends.1 | |
|---|---|---|
| 0 | Daily SMA20 | 1.2513 |
| 1 | Daily SMA50 | 1.2500 |
| 2 | Daily SMA100 | 1.2328 |
| 3 | Daily SMA200 | 1.2051 |
The previous day high was 1.2837 while the previous day low was 1.277. The daily 38.2% Fib levels comes at 1.2796, expected to provide resistance. Similarly, the daily 61.8% fib level is at 1.2812, expected to provide resistance.
Note the levels of interest below:
- Pivot support is noted at 1.2762, 1.2733, 1.2696
- Pivot resistance is noted at 1.2829, 1.2866, 1.2896
| Levels | Levels.1 |
|---|---|
| Previous Daily High | 1.2837 |
| Previous Daily Low | 1.2770 |
| Previous Weekly High | 1.2848 |
| Previous Weekly Low | 1.2487 |
| Previous Monthly High | 1.2680 |
| Previous Monthly Low | 1.2308 |
| Daily Fibonacci 38.2% | 1.2796 |
| Daily Fibonacci 61.8% | 1.2812 |
| Daily Pivot Point S1 | 1.2762 |
| Daily Pivot Point S2 | 1.2733 |
| Daily Pivot Point S3 | 1.2696 |
| Daily Pivot Point R1 | 1.2829 |
| Daily Pivot Point R2 | 1.2866 |
| Daily Pivot Point R3 | 1.2896 |
[/s2If]
Nehcap Expert Advisor
The NEHCAP MT4 EA is high quality professional trading system geared to generate returns without using GRID or martingales. Each trade has strict risk per trade parameter. The pairs under management include EURUSD, GBPUSD, AUDCAD, AUDNZD,GBPAUD, EURAUD, EURCAD, CHFJPY and many more.
The system is trading live: LIVE ACCOUNT TRACKING
You can run it free. Apply for a free trial and track our account. Buy the system or use profit share mechanism to generate returns on your MT4.
Join Our Telegram Group
")


