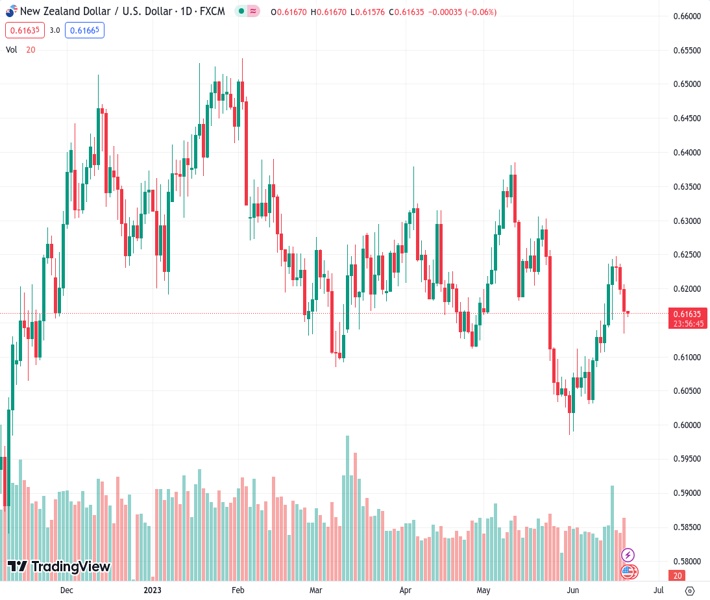
The currency pair of New Zealand Dollar and US Dollar, with a value of 0.61644, dipped under the 100-day Simple Moving Average (SMA) and hit a bottom of 0.6133. However, it later bounced back and steadied at 0.6160.
…
This is a premium post.
[s2If !current_user_can(access_s2member_level4)]Please register for FREE REGISTER to read full post below containing analysis. In case of any error or you think you are not able to read the full post below, please email us at support#nehcap.com [lwa][/s2If] [s2If current_user_can(access_s2member_level1)]
- NZD/USD fell below the 100-day SMA to a low of 0.6133 but recovered and stabilized at 0.6160.
The pair currently trades last at 0.61644.
The previous day high was 0.6237 while the previous day low was 0.6191. The daily 38.2% Fib levels comes at 0.6209, expected to provide resistance. Similarly, the daily 61.8% fib level is at 0.622, expected to provide resistance.
On Tuesday, while US traders returned from their three-day weekend, the NZD/USD dropped to its lowest level in over a week, towards the 0.6130 area. The announcement by the People’s Bank of China (PBoC) to cut rates and a strong USD are the main reasons why the Kiwi weakened.
During the Asian session, the People’s Bank of China announced a reduction of the benchmark Loan Prime Rates (LPRs) by 10 basis points (bps). Moreover, the one-year LPR was cut from 3.65% to 3.55%, while the five-year LPR from 4.30% to 4.20%. In that sense, the rate cuts reminded investors about the weakness seen in the Chinese economic activity, and as China is a huge trading partner of New Zealand, the Kiwi lost traction.
On the other hand, Housing Starts data released by the US Census Bureau for May exceeded expectations, demonstrating a notable increase of 21.7% vs the anticipated decline of 0.8%. In addition, Building Permits from the same month increased 5.2%, while the consensus was a 5% decline. As a reaction, the Greenback, as per the DXY index, held its ground at 102.60, seeing gains on the day despite a decline in US bond yields seen across the board, which signal a cautious market mood amid higher demand for safe-haven bonds. In that sense, the 10-year rate led the fall, seeing a 2.35% decline on the day to 3.73%.
Attention now turns to Jerome Powell’s testimony before Congress during Wednesday’s session, where investors will look for any clues regarding the Federal Reserve monetary policy. In addition, the release of Jobless Claims data on Thursday and S&P PMI data on Friday can also have an impact on the USD price dynamics.
According to the daily chart, the technical outlook for the NZD/USD turned bearish as the bears cleared in the last two sessions, a great deal of last week’s gains. In addition, technicals have fallen into negative territory while the pair now trades below the 100 and 200-day Simple Moving Averages (SMAs).
On the downside, support levels line up at the daily low at the 0.6130 area, followed by the 20-day SMA at 0.6108, and the psychological mark of 0.6100. On the upside, the 100 and 200-day SMA at 0.6150 and 0.6212 are the next resistance to retake in order to reignite bullish momentum.
Technical Levels: Supports and Resistances
NZDUSD currently trading at 0.6167 at the time of writing. Pair opened at 0.6201 and is trading with a change of -0.55 % .
| Overview | Overview.1 | |
|---|---|---|
| 0 | Today last price | 0.6167 |
| 1 | Today Daily Change | -0.0034 |
| 2 | Today Daily Change % | -0.5500 |
| 3 | Today daily open | 0.6201 |
The pair is trading above its 20 Daily moving average @ 0.6114, below its 50 Daily moving average @ 0.6178 , below its 100 Daily moving average @ 0.6216 and above its 200 Daily moving average @ 0.6152
| Trends | Trends.1 | |
|---|---|---|
| 0 | Daily SMA20 | 0.6114 |
| 1 | Daily SMA50 | 0.6178 |
| 2 | Daily SMA100 | 0.6216 |
| 3 | Daily SMA200 | 0.6152 |
The previous day high was 0.6237 while the previous day low was 0.6191. The daily 38.2% Fib levels comes at 0.6209, expected to provide resistance. Similarly, the daily 61.8% fib level is at 0.622, expected to provide resistance.
Note the levels of interest below:
- Pivot support is noted at 0.6182, 0.6163, 0.6136
- Pivot resistance is noted at 0.6229, 0.6256, 0.6275
| Levels | Levels.1 |
|---|---|
| Previous Daily High | 0.6237 |
| Previous Daily Low | 0.6191 |
| Previous Weekly High | 0.6250 |
| Previous Weekly Low | 0.6076 |
| Previous Monthly High | 0.6385 |
| Previous Monthly Low | 0.5985 |
| Daily Fibonacci 38.2% | 0.6209 |
| Daily Fibonacci 61.8% | 0.6220 |
| Daily Pivot Point S1 | 0.6182 |
| Daily Pivot Point S2 | 0.6163 |
| Daily Pivot Point S3 | 0.6136 |
| Daily Pivot Point R1 | 0.6229 |
| Daily Pivot Point R2 | 0.6256 |
| Daily Pivot Point R3 | 0.6275 |
[/s2If]
Nehcap Expert Advisor
The NEHCAP MT4 EA is high quality professional trading system geared to generate returns without using GRID or martingales. Each trade has strict risk per trade parameter. The pairs under management include EURUSD, GBPUSD, AUDCAD, AUDNZD,GBPAUD, EURAUD, EURCAD, CHFJPY and many more.
The system is trading live: LIVE ACCOUNT TRACKING
You can run it free. Apply for a free trial and track our account. Buy the system or use profit share mechanism to generate returns on your MT4.
Join Our Telegram Group
")


