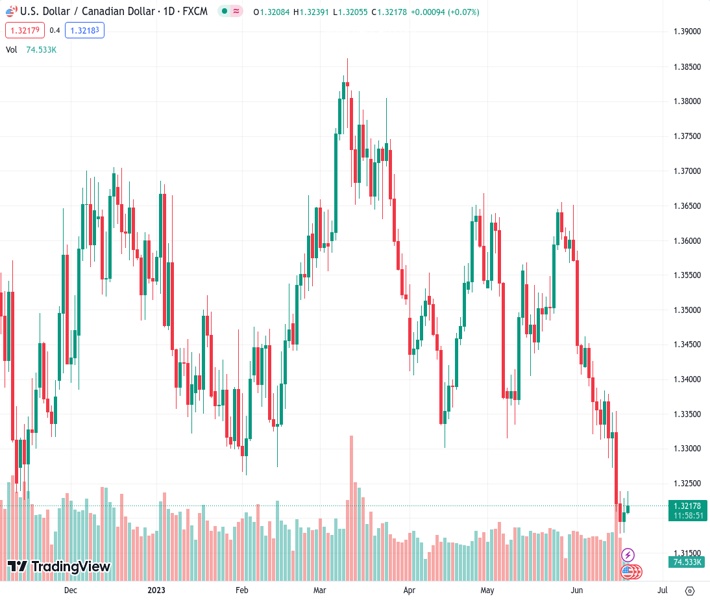
On Tuesday, USDCAD at 1.32173 experiences difficulty in taking full advantage of its small increase during the day.
…
This is a premium post.
[s2If !current_user_can(access_s2member_level4)]Please register for FREE REGISTER to read full post below containing analysis. In case of any error or you think you are not able to read the full post below, please email us at support#nehcap.com [lwa][/s2If] [s2If current_user_can(access_s2member_level1)]
- USD/CAD struggles to capitalize on its modest intraday positive move on Tuesday.
The pair currently trades last at 1.32173.
The previous day high was 1.3229 while the previous day low was 1.3179. The daily 38.2% Fib levels comes at 1.321, expected to provide support. Similarly, the daily 61.8% fib level is at 1.3198, expected to provide support.
The USD/CAD pair attracts some intraday sellers following an early uptick to the 1.3235-1.3240 area on Tuesday and retreats to the lower end of its daily range during the early European session. The pair currently trades just above the 1.3200 mark and remains well within the striking distance of its lowest level since September 2022 touched on Friday.
The US Dollar (USD) struggles to capitalize on its modest intraday gains and for now, seems to have stalled its recent recovery from over a one-month low witnessed over the past two days. Adding to this, a modest uptick in Crude Oil prices underpins the commodity-linked Loonie and acts as a headwind for the USD/CAD pair. Despite the Federal Reserve’s (Fed) hawkish outlook, signalling that borrowing costs may still need to rise as much as 50 bps by the end of this year, investors seem convinced that the US central bank is nearing the end of its year-ling rate-hiking cycle. This, in turn, keeps a lid on any meaningful upside for the Greenback.
The markets, however, are still pricing in another 25 bps lift-off at the July FOMC meeting, which triggers a fresh leg up in the US Treasury bond yields. This, along with a generally weaker tone around the equity markets, could lend some support to the safe-haven Greenback and help limit the downside for the USD/CAD pair, at least for the time being. The market sentiment remains fragile on the back of growing worries about a global economic slowdown, particularly in China. This, to a larger extent, overshadows an interest rate cut by the People’s Bank of China (PBoC), which tempers investors’ appetite for riskier assets and could benefit the buck.
Traders might also refrain from placing aggressive bets and prefer to move to the sidelines ahead of Fed Chair Jerome Powell’s two-day congressional testimony, starting this Wednesday. Powell’s comments will be closely scrutinized for fresh clues about the Fed’s future rate-hike path, which, along with speeches by a slew of influential FOMC members, will play a key role in driving the USD demand this week. Traders this week will also confront the release of the flash PMI prints from the US. Apart from this, Oil price dynamics should contribute to producing some meaningful trading opportunities around the USD/CAD pair.
Technical Levels: Supports and Resistances
USDCAD currently trading at 1.3213 at the time of writing. Pair opened at 1.321 and is trading with a change of 0.02 % .
| Overview | Overview.1 | |
|---|---|---|
| 0 | Today last price | 1.3213 |
| 1 | Today Daily Change | 0.0003 |
| 2 | Today Daily Change % | 0.0200 |
| 3 | Today daily open | 1.3210 |
The pair remains strongly bearish on the daily time frame. It trades below the 20 SMA @ 1.3428, 50 SMA 1.3463, 100 SMA @ 1.351 and 200 SMA @ 1.352.
| Trends | Trends.1 | |
|---|---|---|
| 0 | Daily SMA20 | 1.3428 |
| 1 | Daily SMA50 | 1.3463 |
| 2 | Daily SMA100 | 1.3510 |
| 3 | Daily SMA200 | 1.3520 |
The previous day high was 1.3229 while the previous day low was 1.3179. The daily 38.2% Fib levels comes at 1.321, expected to provide support. Similarly, the daily 61.8% fib level is at 1.3198, expected to provide support.
Note the levels of interest below:
- Pivot support is noted at 1.3183, 1.3156, 1.3133
- Pivot resistance is noted at 1.3233, 1.3256, 1.3282
| Levels | Levels.1 |
|---|---|
| Previous Daily High | 1.3229 |
| Previous Daily Low | 1.3179 |
| Previous Weekly High | 1.3384 |
| Previous Weekly Low | 1.3178 |
| Previous Monthly High | 1.3655 |
| Previous Monthly Low | 1.3315 |
| Daily Fibonacci 38.2% | 1.3210 |
| Daily Fibonacci 61.8% | 1.3198 |
| Daily Pivot Point S1 | 1.3183 |
| Daily Pivot Point S2 | 1.3156 |
| Daily Pivot Point S3 | 1.3133 |
| Daily Pivot Point R1 | 1.3233 |
| Daily Pivot Point R2 | 1.3256 |
| Daily Pivot Point R3 | 1.3282 |
[/s2If]
Nehcap Expert Advisor
The NEHCAP MT4 EA is high quality professional trading system geared to generate returns without using GRID or martingales. Each trade has strict risk per trade parameter. The pairs under management include EURUSD, GBPUSD, AUDCAD, AUDNZD,GBPAUD, EURAUD, EURCAD, CHFJPY and many more.
The system is trading live: LIVE ACCOUNT TRACKING
You can run it free. Apply for a free trial and track our account. Buy the system or use profit share mechanism to generate returns on your MT4.
Join Our Telegram Group
")


