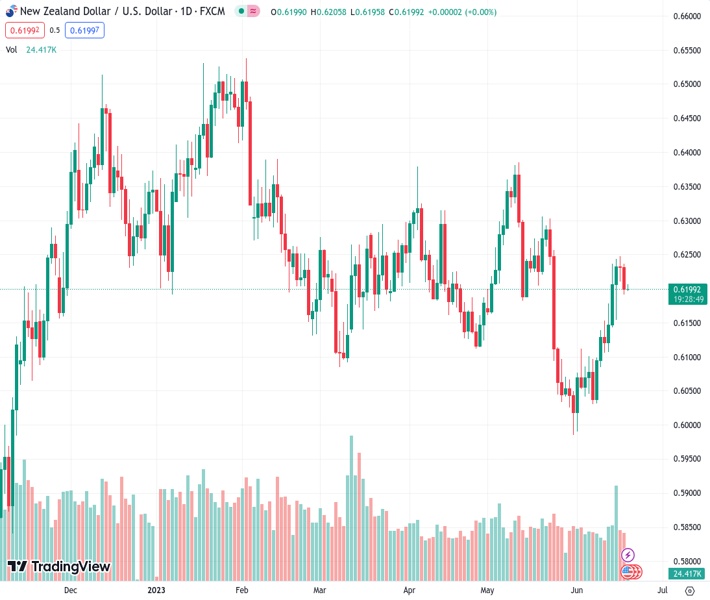
On Tuesday, the NZDUSD pair at 0.61995 faced difficulties in making significant progress due to a slight increase in the USD.
…
This is a premium post.
[s2If !current_user_can(access_s2member_level4)]Please register for FREE REGISTER to read full post below containing analysis. In case of any error or you think you are not able to read the full post below, please email us at support#nehcap.com [lwa][/s2If] [s2If current_user_can(access_s2member_level1)]
- NZD/USD struggles to gain any meaningful traction on Tuesday amid a modest USD uptick.
The pair currently trades last at 0.61995.
The previous day high was 0.6237 while the previous day low was 0.6191. The daily 38.2% Fib levels comes at 0.6209, expected to provide resistance. Similarly, the daily 61.8% fib level is at 0.622, expected to provide resistance.
The NZD/USD pair lacks any firm direction and seesaws between tepid gains/minor losses, around the 0.6200 mark through the first half of the Asian session on Tuesday.
The US Dollar (USD) builds on its bounce from over a one-month high touched last Friday and edges higher for the third straight day, which, in turn, is seen as a key factor acting as a headwind for the NZD/USD pair. The USD uptick could be attributed to a goodish pickup in the US Treasury bond yields, bolstered by rising bets for another 25 bps lift-off at the July FOMC meeting. This comes on the back of the Federal Reserve’s (Fed) hawkish outlook, signalling that borrowing costs may still need to rise by as much as 50 bps by the end of this year, and continues to lend some support to the buck.
Apart from this, a generally weaker tone around the equity markets further benefits the Greenback’s relative safe-haven status and contributes to capping the upside for the risk-sensitive Kiwi. Concerns about a global economic downturn, particularly in China, overshadow reports that China is considering a broad stimulus package to bolster economic support and continues to weigh on investors’ sentiment. Furthermore, the People’s Bank of China cuts one-year and five-year Loan Prime Rates (LPRs) this Tuesday, though does little to inspire bulls or provide any impetus to the NZD/USD pair.
This, along with the Reserve Bank of New Zealand’s (RBNZ) explicit signal that it was done with its most aggressive hiking cycle since 1999, could further undermine the New Zealand Dollar (NZD). Furthermore, New Zealand’s Minister of Finance Grant Robertson and the Treasury criticized higher interest rates. However, expectations that the Fed is nearing the end of its policy tightening cycle might cap the USD and help limit losses for the NZD/USD pair, at least for now. Traders might also refrain from placing aggressive bets ahead of Fed Chair Jerome Powell’s congressional testimony.
Powell’s comments will be closely scrutinized for clues about the Fed’s future rate-hike path, which, in turn, will influence the USD price dynamics and help determine the near-term trajectory for the NZD/USD pair. Nevertheless, the aforementioned fundamental backdrop seems tilted in favour of bearish traders and suggests that the recent strong move-up witnessed over the past two weeks or so has run its course. That said, it will still be prudent to wait for some follow-through selling before positioning for any meaningful corrective decline from the monthly peak touched last Friday.
Technical Levels: Supports and Resistances
NZDUSD currently trading at 0.62 at the time of writing. Pair opened at 0.6201 and is trading with a change of -0.02 % .
| Overview | Overview.1 | |
|---|---|---|
| 0 | Today last price | 0.6200 |
| 1 | Today Daily Change | -0.0001 |
| 2 | Today Daily Change % | -0.0200 |
| 3 | Today daily open | 0.6201 |
The pair is trading above its 20 Daily moving average @ 0.6114, above its 50 Daily moving average @ 0.6178 , below its 100 Daily moving average @ 0.6216 and above its 200 Daily moving average @ 0.6152
| Trends | Trends.1 | |
|---|---|---|
| 0 | Daily SMA20 | 0.6114 |
| 1 | Daily SMA50 | 0.6178 |
| 2 | Daily SMA100 | 0.6216 |
| 3 | Daily SMA200 | 0.6152 |
The previous day high was 0.6237 while the previous day low was 0.6191. The daily 38.2% Fib levels comes at 0.6209, expected to provide resistance. Similarly, the daily 61.8% fib level is at 0.622, expected to provide resistance.
Note the levels of interest below:
- Pivot support is noted at 0.6182, 0.6163, 0.6136
- Pivot resistance is noted at 0.6229, 0.6256, 0.6275
| Levels | Levels.1 |
|---|---|
| Previous Daily High | 0.6237 |
| Previous Daily Low | 0.6191 |
| Previous Weekly High | 0.6250 |
| Previous Weekly Low | 0.6076 |
| Previous Monthly High | 0.6385 |
| Previous Monthly Low | 0.5985 |
| Daily Fibonacci 38.2% | 0.6209 |
| Daily Fibonacci 61.8% | 0.6220 |
| Daily Pivot Point S1 | 0.6182 |
| Daily Pivot Point S2 | 0.6163 |
| Daily Pivot Point S3 | 0.6136 |
| Daily Pivot Point R1 | 0.6229 |
| Daily Pivot Point R2 | 0.6256 |
| Daily Pivot Point R3 | 0.6275 |
[/s2If]
Nehcap Expert Advisor
The NEHCAP MT4 EA is high quality professional trading system geared to generate returns without using GRID or martingales. Each trade has strict risk per trade parameter. The pairs under management include EURUSD, GBPUSD, AUDCAD, AUDNZD,GBPAUD, EURAUD, EURCAD, CHFJPY and many more.
The system is trading live: LIVE ACCOUNT TRACKING
You can run it free. Apply for a free trial and track our account. Buy the system or use profit share mechanism to generate returns on your MT4.
Join Our Telegram Group
")


