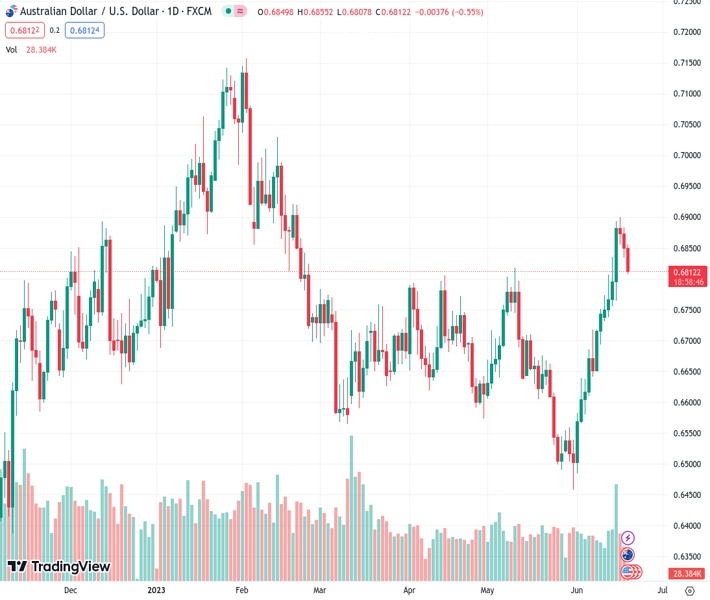
Despite being at 0.68109, the AUDUSD is experiencing a consistent decline for the third day in a row and is at its lowest point for several days.
…
This is a premium post.
[s2If !current_user_can(access_s2member_level4)]Please register for FREE REGISTER to read full post below containing analysis. In case of any error or you think you are not able to read the full post below, please email us at support#nehcap.com [lwa][/s2If] [s2If current_user_can(access_s2member_level1)]
- AUD/USD remains under some selling pressure for the third straight day and drops to a multi-day low.
The pair currently trades last at 0.68109.
The previous day high was 0.6886 while the previous day low was 0.6834. The daily 38.2% Fib levels comes at 0.6854, expected to provide resistance. Similarly, the daily 61.8% fib level is at 0.6866, expected to provide resistance.
The AUD/USD pair drifts lower for the third successive day on Tuesday and drops to a multi-day low, closer to the 0.6800 round-figure mark during the Asian session.
The Australian Dollar (AUD) weakens a bit following the release of the Reserve Bank of Australia (RBA) meeting minutes, which showed that argument between a rate hike and a pause was finely balanced. The board, however, decided the case for an immediate hike was stronger as the balance of risks to inflation had shifted to the upside since the May meeting. The RBA reaffirmed its willingness to do what was necessary to bring inflation to target over a “reasonable” timeframe. This, however, does little to impress bullish traders or lend any support to the AUD/USD pair.
Even reports that China is considering a broad stimulus package to bolster economic support and a move by the People’s Bank of China (PBoC), to cut one-year and five year Loan Prime Rates (LPRs) this Tuesday, fails to lend any support to the Aussie. The US Dollar (USD), on the other hand, gains some positive traction for the third successive day and builds on its recent bounce from over a one-month low amid a goodish pickup in the US Treasury bond yields. Apart from this, a softer risk tone benefits the safe-haven buck and exerts pressure on the AUD/USD pair.
With the latest leg down, spot prices have now retreated nearly 100 pips from the 0.6900 neighbourhood, or the highest level since February 2023 touched last Friday. However, it will still be prudent to wait for strong follow-through selling before confirming that the recent upward trajectory witnessed since the beginning of this month has run out of steam. Traders might also prefer to wait on the sidelines ahead of Fed Chair Jerome Powell’s congressional testimony on Wednesday and Thursday, which might provide fresh clues about the future rate-hike path.
Technical Levels: Supports and Resistances
AUDUSD currently trading at 0.6822 at the time of writing. Pair opened at 0.6851 and is trading with a change of -0.42 % .
| Overview | Overview.1 | |
|---|---|---|
| 0 | Today last price | 0.6822 |
| 1 | Today Daily Change | -0.0029 |
| 2 | Today Daily Change % | -0.4200 |
| 3 | Today daily open | 0.6851 |
The pair remains strongly bullish on the daily timeframe. It trades above its 20 SMA @ 0.6662, 50 SMA 0.6676, 100 SMA @ 0.6726 and 200 SMA @ 0.6692.
| Trends | Trends.1 | |
|---|---|---|
| 0 | Daily SMA20 | 0.6662 |
| 1 | Daily SMA50 | 0.6676 |
| 2 | Daily SMA100 | 0.6726 |
| 3 | Daily SMA200 | 0.6692 |
The previous day high was 0.6886 while the previous day low was 0.6834. The daily 38.2% Fib levels comes at 0.6854, expected to provide resistance. Similarly, the daily 61.8% fib level is at 0.6866, expected to provide resistance.
Note the levels of interest below:
- Pivot support is noted at 0.6827, 0.6804, 0.6775
- Pivot resistance is noted at 0.688, 0.691, 0.6933
| Levels | Levels.1 |
|---|---|
| Previous Daily High | 0.6886 |
| Previous Daily Low | 0.6834 |
| Previous Weekly High | 0.6900 |
| Previous Weekly Low | 0.6732 |
| Previous Monthly High | 0.6818 |
| Previous Monthly Low | 0.6458 |
| Daily Fibonacci 38.2% | 0.6854 |
| Daily Fibonacci 61.8% | 0.6866 |
| Daily Pivot Point S1 | 0.6827 |
| Daily Pivot Point S2 | 0.6804 |
| Daily Pivot Point S3 | 0.6775 |
| Daily Pivot Point R1 | 0.6880 |
| Daily Pivot Point R2 | 0.6910 |
| Daily Pivot Point R3 | 0.6933 |
[/s2If]
Nehcap Expert Advisor
The NEHCAP MT4 EA is high quality professional trading system geared to generate returns without using GRID or martingales. Each trade has strict risk per trade parameter. The pairs under management include EURUSD, GBPUSD, AUDCAD, AUDNZD,GBPAUD, EURAUD, EURCAD, CHFJPY and many more.
The system is trading live: LIVE ACCOUNT TRACKING
You can run it free. Apply for a free trial and track our account. Buy the system or use profit share mechanism to generate returns on your MT4.
Join Our Telegram Group
")


