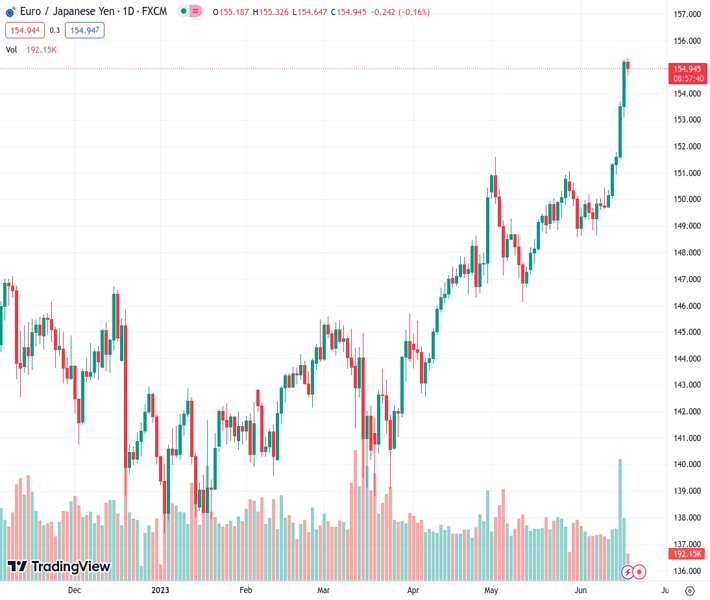
There is some pressure on EURJPY at 154.944 after reaching new highs.
…
This is a premium post.
[s2If !current_user_can(access_s2member_level4)]Please register for FREE REGISTER to read full post below containing analysis. In case of any error or you think you are not able to read the full post below, please email us at support#nehcap.com [lwa][/s2If] [s2If current_user_can(access_s2member_level1)]
- EUR/JPY comes under some pressure following new highs.
The pair currently trades last at 154.944.
The previous day high was 155.27 while the previous day low was 153.09. The daily 38.2% Fib levels comes at 154.44, expected to provide support. Similarly, the daily 61.8% fib level is at 153.93, expected to provide support.
EUR/JPY surrenders some gains and returns to the 155.00 region after advancing to new multi-year higher near 155.30 earlier on Monday’s session.
The current scenario remains open to extra gains in the short-term horizon. Against that, the next up-barrier of certain significance is expected at the weekly top recorded in late September 2008 at 156.83, which precedes the key round level at 157.00.
However, a corrective decline should not be ruled out in the short-term horizon due to the extreme overbought condition of the cross, as per the daily RSI well past the 76 level.
So far, further upside looks favoured while the cross trades above the 200-day SMA, today at 144.51.
Technical Levels: Supports and Resistances
EURJPY currently trading at 155.01 at the time of writing. Pair opened at 155.21 and is trading with a change of -0.13 % .
| Overview | Overview.1 | |
|---|---|---|
| 0 | Today last price | 155.01 |
| 1 | Today Daily Change | 68.00 |
| 2 | Today Daily Change % | -0.13 |
| 3 | Today daily open | 155.21 |
The pair remains strongly bullish on the daily timeframe. It trades above its 20 SMA @ 150.45, 50 SMA 148.91, 100 SMA @ 145.89 and 200 SMA @ 144.5.
| Trends | Trends.1 | |
|---|---|---|
| 0 | Daily SMA20 | 150.45 |
| 1 | Daily SMA50 | 148.91 |
| 2 | Daily SMA100 | 145.89 |
| 3 | Daily SMA200 | 144.50 |
The previous day high was 155.27 while the previous day low was 153.09. The daily 38.2% Fib levels comes at 154.44, expected to provide support. Similarly, the daily 61.8% fib level is at 153.93, expected to provide support.
Note the levels of interest below:
- Pivot support is noted at 153.78, 152.34, 151.59
- Pivot resistance is noted at 155.96, 156.71, 158.14
| Levels | Levels.1 |
|---|---|
| Previous Daily High | 155.27 |
| Previous Daily Low | 153.09 |
| Previous Weekly High | 155.27 |
| Previous Weekly Low | 149.67 |
| Previous Monthly High | 151.62 |
| Previous Monthly Low | 146.14 |
| Daily Fibonacci 38.2% | 154.44 |
| Daily Fibonacci 61.8% | 153.93 |
| Daily Pivot Point S1 | 153.78 |
| Daily Pivot Point S2 | 152.34 |
| Daily Pivot Point S3 | 151.59 |
| Daily Pivot Point R1 | 155.96 |
| Daily Pivot Point R2 | 156.71 |
| Daily Pivot Point R3 | 158.14 |
[/s2If]
Nehcap Expert Advisor
The NEHCAP MT4 EA is high quality professional trading system geared to generate returns without using GRID or martingales. Each trade has strict risk per trade parameter. The pairs under management include EURUSD, GBPUSD, AUDCAD, AUDNZD,GBPAUD, EURAUD, EURCAD, CHFJPY and many more.
The system is trading live: LIVE ACCOUNT TRACKING
You can run it free. Apply for a free trial and track our account. Buy the system or use profit share mechanism to generate returns on your MT4.
Join Our Telegram Group
")


