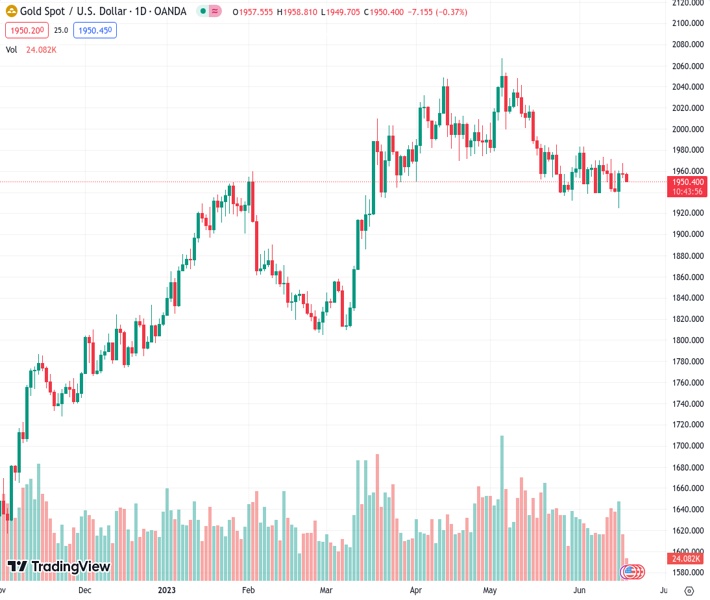
The value of gold, at $1,950.64, has declined to approximately $1,950.00 as a result of indications of a USD Index resurgence.
…
This is a premium post.
[s2If !current_user_can(access_s2member_level4)]Please register for FREE REGISTER to read full post below containing analysis. In case of any error or you think you are not able to read the full post below, please email us at support#nehcap.com [lwa][/s2If] [s2If current_user_can(access_s2member_level1)]
- Gold price has dropped to near $1,950.00 citing recovery signs in the USD Index.
The pair currently trades last at 1950.64.
The previous day high was 1967.96 while the previous day low was 1953.34. The daily 38.2% Fib levels comes at 1958.92, expected to provide resistance. Similarly, the daily 61.8% fib level is at 1962.38, expected to provide resistance.
Gold price (XAU/USD) has printed a fresh day’s low at $1,952.00 as the US Dollar Index (DXY) has attempted a recovery in the European session. The precious metal is declining towards the crucial support of $1,950.00 as investors are turning cautious ahead of US State of Secretary Antony Blinken’s meeting with China’s President XI Jinping.
S&P500 futures are showing nominal gains after recovery losses posted in Asia, which indicates that appeal for US equities is still solid. Investors should note that the overall market mood could turn quiet as US markets will remain closed on Monday on account of Juneteenth.
The US Dollar Index (DXY) has come out of the woods and has climbed to near 103.53. There is a silver line between Federal Reserve’s (Fed) guidance and the expectations of investors for interest rates. Fed Chair Jerome Powell has announced that two small rate hikes are appropriate this year while the street is expecting that the central bank will go with just one hike. United States core inflation is still persistent and labor market conditions are extremely tight, having the potential of denting current expectations.
Elevating caution in the FX domain has also uplifted US Treasury Yields. The yields offered on 10-year US government bonds have jumped above 3.8%.
Gold price has sensed selling pressure from the downward-sloping trendline of the Descending Triangle chart pattern plotted from June 02 high at $1,983.50 on a four-hour scale. The horizontal support is placed from May 30 low at $1,932.12. The broader cushion is placed from March 15 high at $1,937.39.
The 200-period Exponential Moving Average (EMA) at $1,966.70 is acting as a barricade for the Gold bulls, which indicates that the long-term trend is bearish.
Meanwhile, the Relative Strength Index (RSI) (14) is oscillating in the 40.00-60.00 range, portraying a lackluster performance.
Technical Levels: Supports and Resistances
XAUUSD currently trading at 1950.41 at the time of writing. Pair opened at 1957.98 and is trading with a change of -0.39 % .
| Overview | Overview.1 | |
|---|---|---|
| 0 | Today last price | 1950.41 |
| 1 | Today Daily Change | -7.57 |
| 2 | Today Daily Change % | -0.39 |
| 3 | Today daily open | 1957.98 |
The pair is trading below its 20 Daily moving average @ 1956.8, below its 50 Daily moving average @ 1985.33 , above its 100 Daily moving average @ 1942.08 and above its 200 Daily moving average @ 1847.63
| Trends | Trends.1 | |
|---|---|---|
| 0 | Daily SMA20 | 1956.80 |
| 1 | Daily SMA50 | 1985.33 |
| 2 | Daily SMA100 | 1942.08 |
| 3 | Daily SMA200 | 1847.63 |
The previous day high was 1967.96 while the previous day low was 1953.34. The daily 38.2% Fib levels comes at 1958.92, expected to provide resistance. Similarly, the daily 61.8% fib level is at 1962.38, expected to provide resistance.
Note the levels of interest below:
- Pivot support is noted at 1951.56, 1945.14, 1936.94
- Pivot resistance is noted at 1966.18, 1974.38, 1980.8
| Levels | Levels.1 |
|---|---|
| Previous Daily High | 1967.96 |
| Previous Daily Low | 1953.34 |
| Previous Weekly High | 1971.01 |
| Previous Weekly Low | 1924.85 |
| Previous Monthly High | 2079.76 |
| Previous Monthly Low | 1932.12 |
| Daily Fibonacci 38.2% | 1958.92 |
| Daily Fibonacci 61.8% | 1962.38 |
| Daily Pivot Point S1 | 1951.56 |
| Daily Pivot Point S2 | 1945.14 |
| Daily Pivot Point S3 | 1936.94 |
| Daily Pivot Point R1 | 1966.18 |
| Daily Pivot Point R2 | 1974.38 |
| Daily Pivot Point R3 | 1980.80 |
[/s2If]
Nehcap Expert Advisor
The NEHCAP MT4 EA is high quality professional trading system geared to generate returns without using GRID or martingales. Each trade has strict risk per trade parameter. The pairs under management include EURUSD, GBPUSD, AUDCAD, AUDNZD,GBPAUD, EURAUD, EURCAD, CHFJPY and many more.
The system is trading live: LIVE ACCOUNT TRACKING
You can run it free. Apply for a free trial and track our account. Buy the system or use profit share mechanism to generate returns on your MT4.
Join Our Telegram Group
")


