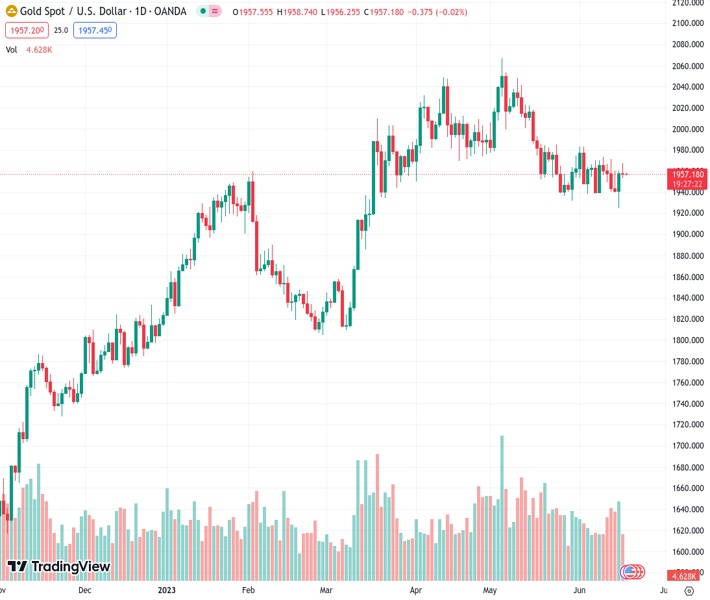
The price of gold, symbolized as #XAUUSD at 1,957.86, has been trading in a tight range for two consecutive days as of Monday.
…
This is a premium post.
[s2If !current_user_can(access_s2member_level4)]Please register for FREE REGISTER to read full post below containing analysis. In case of any error or you think you are not able to read the full post below, please email us at support#nehcap.com [lwa][/s2If] [s2If current_user_can(access_s2member_level1)]
- Gold price remains confined in a narrow trading band for the second straight day on Monday.
The pair currently trades last at 1957.86.
The previous day high was 1967.96 while the previous day low was 1953.34. The daily 38.2% Fib levels comes at 1958.92, expected to provide resistance. Similarly, the daily 61.8% fib level is at 1962.38, expected to provide resistance.
Gold price continues with its struggle to gain any meaningful traction on Monday and oscillates in a narrow trading band for the second straight day. The XAU/USD currently trades just below the $1,960 level during the Asian session, albeit, so far, has managed to hold its neck above the 100-hour Simple Moving Average (SMA).
The US Dollar (USD) edges higher on the first day of the new week and looks to build on Friday’s modest recovery from over a one-month low in the wake of the Federal Reserve’s hawkish outlook. It is worth recalling that the Fed last week signalled that borrowing costs may still need to rise by as much as 50 bps by the end of this year. This, in turn, is seen as a key factor acting as a headwind for the US Dollar-denominated Gold price.
The recent softer macro data from the United States (US), however, raised questions over how much headroom the Fed has to keep raising rates. In fact, market participants seem confident that the Fed is almost done with its tightening, which is holding back the USD bulls from placing aggressive bets and lending support to the Gold price. Apart from this, a softer risk tone is seen as another factor underpinning the safe-haven XAU/USD.
Any meaningful upside, meanwhile, still seems elusive amid a more hawkish stance adopted by other major central banks. It is worth recalling that the Reserve Bank of Australia (RBA) and the Bank of Canada (BoC) delivered a surprise 25 basis point (bps) rate hike earlier this month. Moreover, the European Central Bank (ECB) last week lifted rates by 25 bps, to the highest level in 22 years, and indicated further tightening to bring down inflation.
The Bank of England (BoE) and the Swiss National Bank (SNB) are also expected to hike interest rates by 25 bps later this week, which might further contribute to capping the Gold price. In the absence of any relevant macro data and lighter trading volumes on the back of a bank holiday in the US, the mixed fundamental backdrop warrants caution before positioning for any meaningful recovery from a nearly three-month low touched last Thursday.
From a technical perspective, the 100-day SMA, currently around the $1,942 area, is likely to protect the immediate downside ahead of the $1,932 region and the monthly swing low, around the $1,925-$1,924 zone. Some follow-through selling will be seen as a fresh trigger for bearish traders and make the Gold price vulnerable to accelerate the fall towards the $1,900 round figure. The downward trajectory could get extended further and drag the XAU/USD towards the $1,876-$1,875 horizontal support en route to the very important 200-day SMA, currently around the $1,839 region.
On the flip side, the immediate hurdle is pegged near the $1,962-$1,964 region ahead of the $1,970-$1,972 supply zone. This is followed by the $1,983-$1,985 resistance, above which a bout of a short-covering has the potential to lift the Gold price beyond the $2,000 psychological mark, towards the next relevant barrier near the $2,010-$2,012 region.
Technical Levels: Supports and Resistances
XAUUSD currently trading at 1956.71 at the time of writing. Pair opened at 1957.98 and is trading with a change of -0.06 % .
| Overview | Overview.1 | |
|---|---|---|
| 0 | Today last price | 1956.71 |
| 1 | Today Daily Change | -1.27 |
| 2 | Today Daily Change % | -0.06 |
| 3 | Today daily open | 1957.98 |
The pair is trading below its 20 Daily moving average @ 1956.8, below its 50 Daily moving average @ 1985.33 , above its 100 Daily moving average @ 1942.08 and above its 200 Daily moving average @ 1847.63
| Trends | Trends.1 | |
|---|---|---|
| 0 | Daily SMA20 | 1956.80 |
| 1 | Daily SMA50 | 1985.33 |
| 2 | Daily SMA100 | 1942.08 |
| 3 | Daily SMA200 | 1847.63 |
The previous day high was 1967.96 while the previous day low was 1953.34. The daily 38.2% Fib levels comes at 1958.92, expected to provide resistance. Similarly, the daily 61.8% fib level is at 1962.38, expected to provide resistance.
Note the levels of interest below:
- Pivot support is noted at 1951.56, 1945.14, 1936.94
- Pivot resistance is noted at 1966.18, 1974.38, 1980.8
| Levels | Levels.1 |
|---|---|
| Previous Daily High | 1967.96 |
| Previous Daily Low | 1953.34 |
| Previous Weekly High | 1971.01 |
| Previous Weekly Low | 1924.85 |
| Previous Monthly High | 2079.76 |
| Previous Monthly Low | 1932.12 |
| Daily Fibonacci 38.2% | 1958.92 |
| Daily Fibonacci 61.8% | 1962.38 |
| Daily Pivot Point S1 | 1951.56 |
| Daily Pivot Point S2 | 1945.14 |
| Daily Pivot Point S3 | 1936.94 |
| Daily Pivot Point R1 | 1966.18 |
| Daily Pivot Point R2 | 1974.38 |
| Daily Pivot Point R3 | 1980.80 |
[/s2If]
Nehcap Expert Advisor
The NEHCAP MT4 EA is high quality professional trading system geared to generate returns without using GRID or martingales. Each trade has strict risk per trade parameter. The pairs under management include EURUSD, GBPUSD, AUDCAD, AUDNZD,GBPAUD, EURAUD, EURCAD, CHFJPY and many more.
The system is trading live: LIVE ACCOUNT TRACKING
You can run it free. Apply for a free trial and track our account. Buy the system or use profit share mechanism to generate returns on your MT4.
Join Our Telegram Group
")


