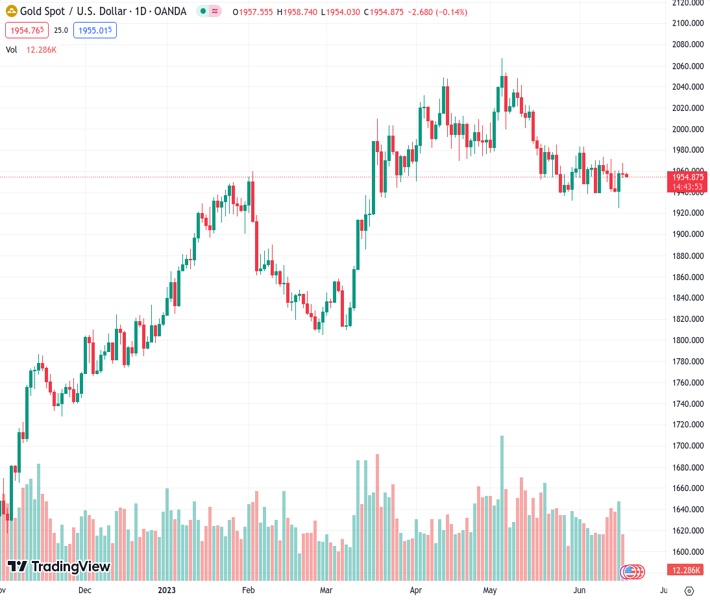
The price of gold, represented by XAUUSD at 1,955.15, is having difficulty gaining significant momentum and is fluctuating within a certain range on Monday.
…
This is a premium post.
[s2If !current_user_can(access_s2member_level4)]Please register for FREE REGISTER to read full post below containing analysis. In case of any error or you think you are not able to read the full post below, please email us at support#nehcap.com [lwa][/s2If] [s2If current_user_can(access_s2member_level1)]
- Gold price struggles to gain any meaningful traction and oscillates in a range on Monday.
The pair currently trades last at 1955.15.
The previous day high was 1967.96 while the previous day low was 1953.34. The daily 38.2% Fib levels comes at 1958.92, expected to provide resistance. Similarly, the daily 61.8% fib level is at 1962.38, expected to provide resistance.
Gold price ticks lower on the first day of a new week and trades with a mild negative bias, just below the $1,955 level heading into the European session.
The Federal Reserve (Fed) last week signalled that borrowing costs may still need to rise by as much as 50 basis points (bps) by the end of this year, which assists the US Dollar (USD) to gain some positive traction for the second successive day. In fact, the USD Index (DXY), which tracks the Greenback against a basket of currencies, looks to build on Friday’s modest bounce from over a one-month low and acts as a headwind for the US Dollar-denominated Gold price.
Apart from this, a more hawkish outlook by major central banks further contributes to capping the upside for the non-yielding Gold price. It is worth recalling that the Reserve Bank of Australia (RBA) and the Bank of Canada (BoC) delivered a surprise 25 bps rate hike earlier this month. Moreover, the European Central Bank (ECB) last week lifted rates by 25 bps, to the highest level in 22 years, and projected indicated further tightening to bring down inflation.
The Bank of England (BoE) and the Swiss National Bank (SNB) are also expected to hike interest rates by 25 bps later this week. That said, a generally weaker tone around the equity markets helps the safe-haven Gold price to hold its neck just above the 100-hour Simple Moving Average (SMA) support. Worries about a global economic downturn, particularly in China, weigh on investors’ sentiment and drive some haven flows, warranting caution for bearish traders.
Investors might also prefer to wait on the sidelines ahead of Fed Chair Jerome Powell’s two-day congressional testimony on Wednesday and Thursday, which will be looked for fresh clues about the future rate-hike path. This, in turn, will play a key role in influencing the near-term USD price dynamics and provide some meaningful impetus to the Gold price. This makes it prudent to wait for some follow-through selling below the 100-day SMA before positioning for any further losses.
Technical Levels: Supports and Resistances
XAUUSD currently trading at 1954.68 at the time of writing. Pair opened at 1957.98 and is trading with a change of -0.17 % .
| Overview | Overview.1 | |
|---|---|---|
| 0 | Today last price | 1954.68 |
| 1 | Today Daily Change | -3.30 |
| 2 | Today Daily Change % | -0.17 |
| 3 | Today daily open | 1957.98 |
The pair is trading below its 20 Daily moving average @ 1956.8, below its 50 Daily moving average @ 1985.33 , above its 100 Daily moving average @ 1942.08 and above its 200 Daily moving average @ 1847.63
| Trends | Trends.1 | |
|---|---|---|
| 0 | Daily SMA20 | 1956.80 |
| 1 | Daily SMA50 | 1985.33 |
| 2 | Daily SMA100 | 1942.08 |
| 3 | Daily SMA200 | 1847.63 |
The previous day high was 1967.96 while the previous day low was 1953.34. The daily 38.2% Fib levels comes at 1958.92, expected to provide resistance. Similarly, the daily 61.8% fib level is at 1962.38, expected to provide resistance.
Note the levels of interest below:
- Pivot support is noted at 1951.56, 1945.14, 1936.94
- Pivot resistance is noted at 1966.18, 1974.38, 1980.8
| Levels | Levels.1 |
|---|---|
| Previous Daily High | 1967.96 |
| Previous Daily Low | 1953.34 |
| Previous Weekly High | 1971.01 |
| Previous Weekly Low | 1924.85 |
| Previous Monthly High | 2079.76 |
| Previous Monthly Low | 1932.12 |
| Daily Fibonacci 38.2% | 1958.92 |
| Daily Fibonacci 61.8% | 1962.38 |
| Daily Pivot Point S1 | 1951.56 |
| Daily Pivot Point S2 | 1945.14 |
| Daily Pivot Point S3 | 1936.94 |
| Daily Pivot Point R1 | 1966.18 |
| Daily Pivot Point R2 | 1974.38 |
| Daily Pivot Point R3 | 1980.80 |
[/s2If]
Nehcap Expert Advisor
The NEHCAP MT4 EA is high quality professional trading system geared to generate returns without using GRID or martingales. Each trade has strict risk per trade parameter. The pairs under management include EURUSD, GBPUSD, AUDCAD, AUDNZD,GBPAUD, EURAUD, EURCAD, CHFJPY and many more.
The system is trading live: LIVE ACCOUNT TRACKING
You can run it free. Apply for a free trial and track our account. Buy the system or use profit share mechanism to generate returns on your MT4.
Join Our Telegram Group
")


