The price of gold, represented by XAUUSD at 1,948.18, has decreased due to the US markets being closed and the increase in bond yields.
…
This is a premium post.
[s2If !current_user_can(access_s2member_level4)]Please register for FREE REGISTER to read full post below containing analysis. In case of any error or you think you are not able to read the full post below, please email us at support#nehcap.com [lwa][/s2If] [s2If current_user_can(access_s2member_level1)]
- Gold price slips amid closed US markets and rising bond yields.
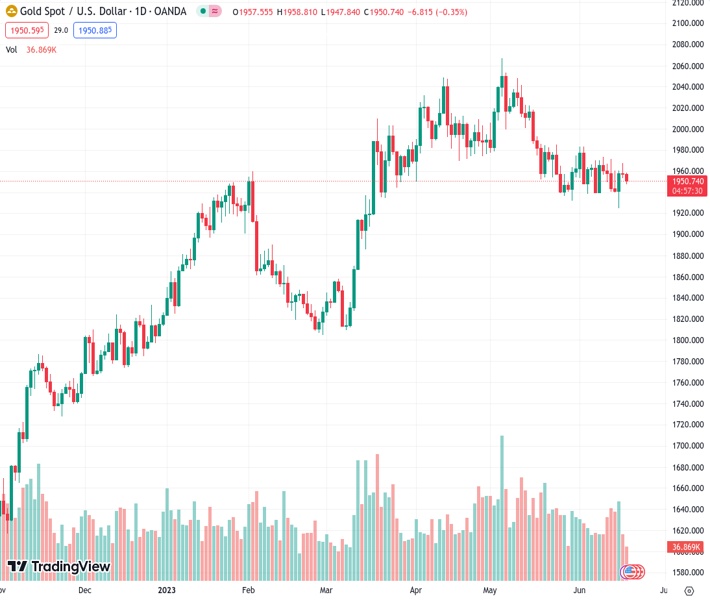
The pair currently trades last at 1948.18.
The previous day high was 1967.96 while the previous day low was 1953.34. The daily 38.2% Fib levels comes at 1958.92, expected to provide resistance. Similarly, the daily 61.8% fib level is at 1962.38, expected to provide resistance.
Gold price trades with minimal losses amidst a quiet US session due to a holiday in the United States (US). Therefore as US markets are closed, thin liquidity conditions drive price action. At the time of writing, XAU/USD is trading at $1952.52 after hitting a daily high of $1958.73.
European equities are trading negatively following a week that witnessed three major central banks delivering monetary policy decisions. The Federal Reserve (Fed) kept rates unchanged but foresaw peak rates at 5.6%, according to the dot-plot in the Summary of Economic Projections (SEP). Since then, officials have expressed the likelihood of raising rates at the July meeting, but the recent rally in US stocks portrays investors are not “buying” a more aggressive Fed.
As US markets remain closed, XAU/USD trading is dictated by yield performance on last Friday’s session. The 10-year benchmark note rate sits at 3.767%, while US real yields, calculated with the nominal yield minus inflation expectations, sit at 1.547%, still below the 2023 high of 1.719%. With US bond yields remaining higher, XAU/USD would likely remain pressured, as high yields, usually mean a stronger US Dollar (USD).
The US Dollar Index (DXY), a measure of the buck’s value against a basket of peers, climbs 0.13% at 102.436.
In the weekend events, US-China talks resumed as the US Secretary of State Anthony Blinken met with its counterpart, the Chinese Foreign Minister Qin, in Beijing. Blinken emphasized the importance of diplomacy and maintaining open channels with China as he invited Qin to Washington. Meanwhile, Qin commented that China is committed to building a stable, predictable, and constructive relationship with the US while maintaining its stance on Taiwan.
Regarding US data, the US NAHB Housing Market Index for June improved from 50 to 55, smashing estimates and, according to the report, the highest reading since July 2022. The report highlighted solid demand and the lack of inventory as the main reasons for the surprising jump.
The US economic agenda will reveal additional housing data, the US Federal Reserve Chair Jerome Powell’s testimony at the US Congress, and a solid Fed parade, ready to rock the markets.
XAU/USD is trading sideways, in an area “vigilant” by the 20 and the 100-day Exponential Moving Averages (EMAs), at $1959.99 and $1939.79, respectively. Even though XAU/USD broke below a symmetrical triangle on a downtrend, it recovered lost territory and negated the pattern. Nevertheless, XAU/USD is trading in a descending channel, while the Relative Strength Index (RSI) and the three-day Rate of Change (RoC) suggest sellers remain in charge. XAU/USD’s first support would be the 100-day EMA at $1939.79. Break below will expose additional support areas, like the June 15 low of $1925.06, ahead of the $1900 figure. On the other hand, XAU/USD’s first resistance would be the 20-day EMA at $1959.95, closely followed by the 50-day EMA at $1964.76, ahead of the top trendline of the descending channel at around $1970-80.
Technical Levels: Supports and Resistances
XAUUSD currently trading at 1952.97 at the time of writing. Pair opened at 1957.98 and is trading with a change of -0.26 % .
| Overview | Overview.1 | |
|---|---|---|
| 0 | Today last price | 1952.97 |
| 1 | Today Daily Change | -5.01 |
| 2 | Today Daily Change % | -0.26 |
| 3 | Today daily open | 1957.98 |
The pair is trading below its 20 Daily moving average @ 1956.8, below its 50 Daily moving average @ 1985.33 , above its 100 Daily moving average @ 1942.08 and above its 200 Daily moving average @ 1847.63
| Trends | Trends.1 | |
|---|---|---|
| 0 | Daily SMA20 | 1956.80 |
| 1 | Daily SMA50 | 1985.33 |
| 2 | Daily SMA100 | 1942.08 |
| 3 | Daily SMA200 | 1847.63 |
The previous day high was 1967.96 while the previous day low was 1953.34. The daily 38.2% Fib levels comes at 1958.92, expected to provide resistance. Similarly, the daily 61.8% fib level is at 1962.38, expected to provide resistance.
Note the levels of interest below:
- Pivot support is noted at 1951.56, 1945.14, 1936.94
- Pivot resistance is noted at 1966.18, 1974.38, 1980.8
| Levels | Levels.1 |
|---|---|
| Previous Daily High | 1967.96 |
| Previous Daily Low | 1953.34 |
| Previous Weekly High | 1971.01 |
| Previous Weekly Low | 1924.85 |
| Previous Monthly High | 2079.76 |
| Previous Monthly Low | 1932.12 |
| Daily Fibonacci 38.2% | 1958.92 |
| Daily Fibonacci 61.8% | 1962.38 |
| Daily Pivot Point S1 | 1951.56 |
| Daily Pivot Point S2 | 1945.14 |
| Daily Pivot Point S3 | 1936.94 |
| Daily Pivot Point R1 | 1966.18 |
| Daily Pivot Point R2 | 1974.38 |
| Daily Pivot Point R3 | 1980.80 |
[/s2If]
Nehcap Expert Advisor
The NEHCAP MT4 EA is high quality professional trading system geared to generate returns without using GRID or martingales. Each trade has strict risk per trade parameter. The pairs under management include EURUSD, GBPUSD, AUDCAD, AUDNZD,GBPAUD, EURAUD, EURCAD, CHFJPY and many more.
The system is trading live: LIVE ACCOUNT TRACKING
You can run it free. Apply for a free trial and track our account. Buy the system or use profit share mechanism to generate returns on your MT4.
Join Our Telegram Group
")


