The NZDUSD is currently being pushed down due to a bearish chart pattern and is defending against a decrease from its previous day’s three-week high of 0.62220. However, Nehcap predicts that there will be only a slight decrease in value and not a significant downfall.
…
This is a premium post.
[s2If !current_user_can(access_s2member_level4)]Please register for FREE REGISTER to read full post below containing analysis. In case of any error or you think you are not able to read the full post below, please email us at support#nehcap.com [lwa][/s2If] [s2If current_user_can(access_s2member_level1)]
- NZD/USD remains pressured within bearish chart formation, defends previous day’s pullback from three-week high.
The pair currently trades last at 0.62220.
The previous day high was 0.625 while the previous day low was 0.6209. The daily 38.2% Fib levels comes at 0.6225, expected to provide resistance. Similarly, the daily 61.8% fib level is at 0.6235, expected to provide resistance.
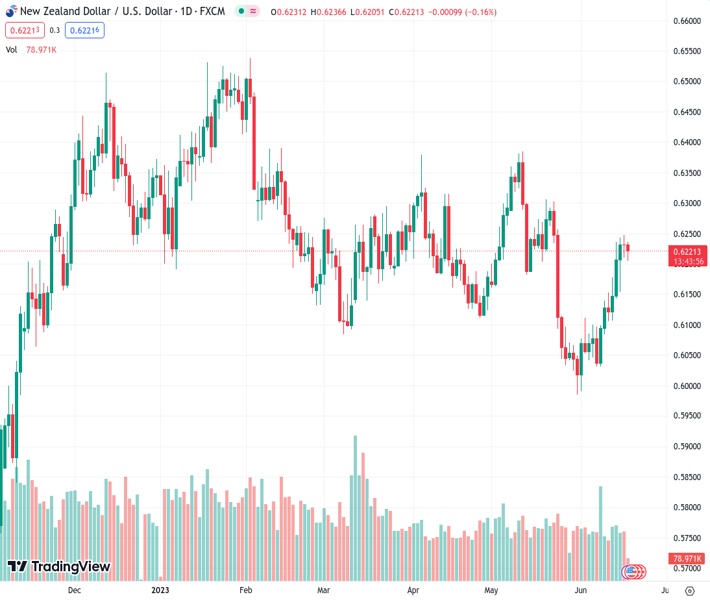
NZD/USD bounces off intraday low as it struggles to confirm the fortnight-old rising wedge bearish chart formation amid early Monday morning in Europe. That said, the Kiwi pair licks its wounds near 0.6215 while keeping the previous day’s retreat from the monthly peak.
It’s worth noting that the lower-high formation joins the bearish MACD signals to lure the NZD/USD sellers. However, a clear downside beak of the stated rising wedge’s bottom line, around 0.6200 by the press time becomes necessary for the sellers to keep the reins.
Even so, the 200-SMA support of near 0.6175 can prod the bears.
Above all, a convergence of the 100-SMA and the previous resistance line stretched from early May, near 0.6100. appears crucial support to break for the NZD/USD sellers to retake control.
Meanwhile, a descending resistance line from Thursday, near 0.6240 at the latest, restricts the immediate upside of the NZD/USD pair ahead of the stated wedge’s top line, close to 0.6280 at the latest.
Should the Kiwi price remains firmer past 0.6280, the odds of witnessing a run-up toward the previous monthly high of nearly 0.6385 can’t be ruled out.
Trend: Limited downside expected
Technical Levels: Supports and Resistances
NZDUSD currently trading at 0.6222 at the time of writing. Pair opened at 0.6211 and is trading with a change of 0.18% % .
| Overview | Overview.1 | |
|---|---|---|
| 0 | Today last price | 0.6222 |
| 1 | Today Daily Change | 0.0011 |
| 2 | Today Daily Change % | 0.18% |
| 3 | Today daily open | 0.6211 |
The pair remains strongly bullish on the daily timeframe. It trades above its 20 SMA @ 0.6118, 50 SMA 0.6178, 100 SMA @ 0.6218 and 200 SMA @ 0.6152.
| Trends | Trends.1 | |
|---|---|---|
| 0 | Daily SMA20 | 0.6118 |
| 1 | Daily SMA50 | 0.6178 |
| 2 | Daily SMA100 | 0.6218 |
| 3 | Daily SMA200 | 0.6152 |
The previous day high was 0.625 while the previous day low was 0.6209. The daily 38.2% Fib levels comes at 0.6225, expected to provide resistance. Similarly, the daily 61.8% fib level is at 0.6235, expected to provide resistance.
Note the levels of interest below:
- Pivot support is noted at 0.6196, 0.6182, 0.6155
- Pivot resistance is noted at 0.6238, 0.6265, 0.628
| Levels | Levels.1 |
|---|---|
| Previous Daily High | 0.6250 |
| Previous Daily Low | 0.6209 |
| Previous Weekly High | 0.6250 |
| Previous Weekly Low | 0.6076 |
| Previous Monthly High | 0.6385 |
| Previous Monthly Low | 0.5985 |
| Daily Fibonacci 38.2% | 0.6225 |
| Daily Fibonacci 61.8% | 0.6235 |
| Daily Pivot Point S1 | 0.6196 |
| Daily Pivot Point S2 | 0.6182 |
| Daily Pivot Point S3 | 0.6155 |
| Daily Pivot Point R1 | 0.6238 |
| Daily Pivot Point R2 | 0.6265 |
| Daily Pivot Point R3 | 0.6280 |
[/s2If]
Nehcap Expert Advisor
The NEHCAP MT4 EA is high quality professional trading system geared to generate returns without using GRID or martingales. Each trade has strict risk per trade parameter. The pairs under management include EURUSD, GBPUSD, AUDCAD, AUDNZD,GBPAUD, EURAUD, EURCAD, CHFJPY and many more.
The system is trading live: LIVE ACCOUNT TRACKING
You can run it free. Apply for a free trial and track our account. Buy the system or use profit share mechanism to generate returns on your MT4.
Join Our Telegram Group
")


