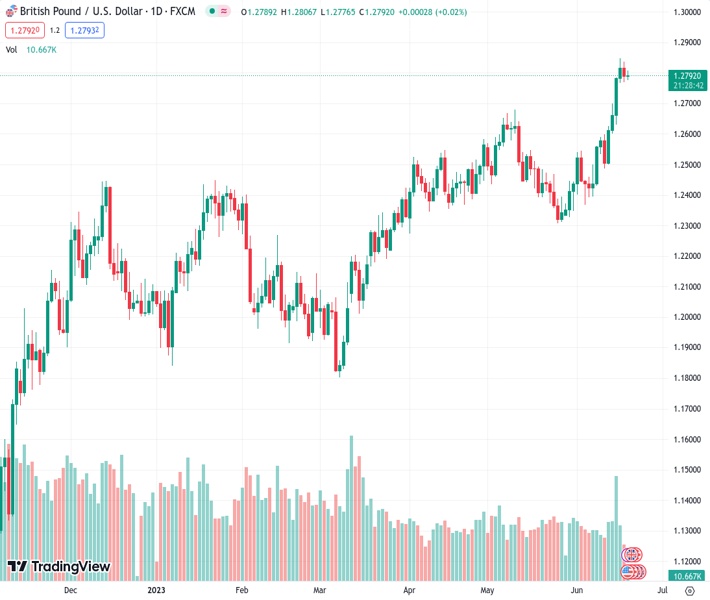
The GBPUSD pair, currently trading at 1.27960, has seen an increase in demand, leading to a reversal of the earlier decline from its peak levels of April 2022. In my opinion, there is potential for additional price gains.
…
This is a premium post.
[s2If !current_user_can(access_s2member_level4)]Please register for FREE REGISTER to read full post below containing analysis. In case of any error or you think you are not able to read the full post below, please email us at support#nehcap.com [lwa][/s2If] [s2If current_user_can(access_s2member_level1)]
- GBP/USD picks up bids to reverse the week-start pullback from the highest levels since April 2022.
The pair currently trades last at 1.27960.
The previous day high was 1.2848 while the previous day low was 1.2768. The daily 38.2% Fib levels comes at 1.2818, expected to provide resistance. Similarly, the daily 61.8% fib level is at 1.2799, expected to provide resistance.
GBP/USD regains upside momentum, after a downbeat start of the week, as it rises to 1.2800 amid the early hours of Tuesday’s Asian session. In doing so, the Cable pair seesaws around the highest levels in 14 months by staying within a one-week-long bullish trend channel.
Apart from the bullish channel, the 21-SMA level and hawkish hopes from the Bank of England (BoE), amid upbeat inflation pressure in the UK, also underpin the upside bias surrounding the Pound Sterling price.
It should be noted that the latest update from Lloyds Bank stated that the British food manufacturers reported the first drop in their production costs since 2016 in May as lower commodity and energy prices and cheaper shipping outweighed a jump in wage bills. The same highlights Wednesday’s UK inflation data ahead of Thursday’s BoE announcements and becomes crucial for the GBP/USD pair traders to watch.
It’s worth noting that the RSI (14) is still overbought and the MACD flashes bearish signals as the GBP/USD price prints a lower-high formation.
With this, the Cable buyers need to witness a clear break of the recent downward spell by crossing the 1.2820 hurdle to recall the bulls.
Following that, the latest multi-day peak of around 1.2850 and the stated channel’s peak of around 1.2910 can lure the GBP/USD buyers before highlighting the 1.3000 round figure.
On the other hand, a downside break of convergence of the 21-SMA and the bullish channel’s lower line, close to 1.2760 by the press time, could trigger the short-term downside of the GBP/USD pair.
However, the top line of the previous bullish channel stretched from late May, surrounding 1.2650 at the latest, can challenge the GBP/USD sellers before welcoming them, even for a short term.
Trend: Further upside expected
Technical Levels: Supports and Resistances
GBPUSD currently trading at 1.2799 at the time of writing. Pair opened at 1.2822 and is trading with a change of -0.18% % .
| Overview | Overview.1 | |
|---|---|---|
| 0 | Today last price | 1.2799 |
| 1 | Today Daily Change | -0.0023 |
| 2 | Today Daily Change % | -0.18% |
| 3 | Today daily open | 1.2822 |
The pair remains strongly bullish on the daily timeframe. It trades above its 20 SMA @ 1.2495, 50 SMA 1.2492, 100 SMA @ 1.2324 and 200 SMA @ 1.2045.
| Trends | Trends.1 | |
|---|---|---|
| 0 | Daily SMA20 | 1.2495 |
| 1 | Daily SMA50 | 1.2492 |
| 2 | Daily SMA100 | 1.2324 |
| 3 | Daily SMA200 | 1.2045 |
The previous day high was 1.2848 while the previous day low was 1.2768. The daily 38.2% Fib levels comes at 1.2818, expected to provide resistance. Similarly, the daily 61.8% fib level is at 1.2799, expected to provide resistance.
Note the levels of interest below:
- Pivot support is noted at 1.2777, 1.2733, 1.2697
- Pivot resistance is noted at 1.2857, 1.2893, 1.2937
| Levels | Levels.1 |
|---|---|
| Previous Daily High | 1.2848 |
| Previous Daily Low | 1.2768 |
| Previous Weekly High | 1.2848 |
| Previous Weekly Low | 1.2487 |
| Previous Monthly High | 1.2680 |
| Previous Monthly Low | 1.2308 |
| Daily Fibonacci 38.2% | 1.2818 |
| Daily Fibonacci 61.8% | 1.2799 |
| Daily Pivot Point S1 | 1.2777 |
| Daily Pivot Point S2 | 1.2733 |
| Daily Pivot Point S3 | 1.2697 |
| Daily Pivot Point R1 | 1.2857 |
| Daily Pivot Point R2 | 1.2893 |
| Daily Pivot Point R3 | 1.2937 |
[/s2If]
Nehcap Expert Advisor
The NEHCAP MT4 EA is high quality professional trading system geared to generate returns without using GRID or martingales. Each trade has strict risk per trade parameter. The pairs under management include EURUSD, GBPUSD, AUDCAD, AUDNZD,GBPAUD, EURAUD, EURCAD, CHFJPY and many more.
The system is trading live: LIVE ACCOUNT TRACKING
You can run it free. Apply for a free trial and track our account. Buy the system or use profit share mechanism to generate returns on your MT4.
Join Our Telegram Group
")


