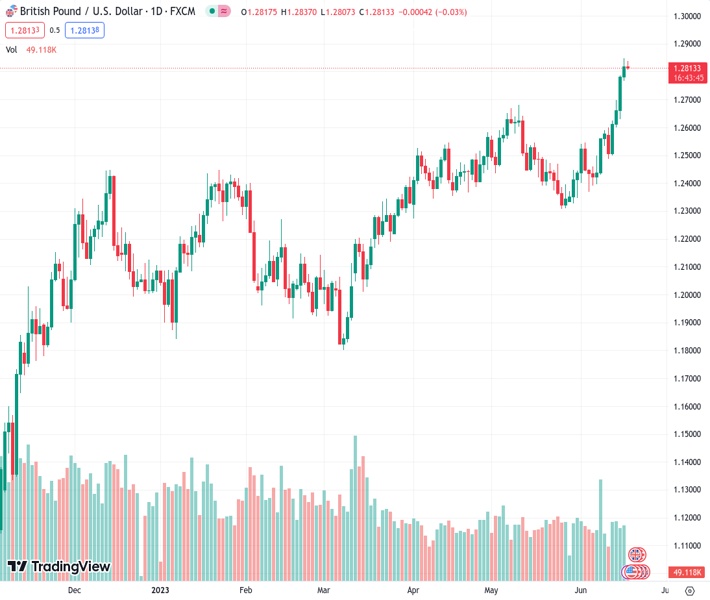
The GBP/USD pair at a rate of 1.28129 has dropped from its previous top levels since April 2022, putting a halt on its four-day upward trend. @nehcap predicts a decline in this currency pair’s value.
…
This is a premium post.
[s2If !current_user_can(access_s2member_level4)]Please register for FREE REGISTER to read full post below containing analysis. In case of any error or you think you are not able to read the full post below, please email us at support#nehcap.com [lwa][/s2If] [s2If current_user_can(access_s2member_level1)]
- GBP/USD retreats from the highest levels since April 2022, snaps four-day uptrend.
The pair currently trades last at 1.28129.
The previous day high was 1.2848 while the previous day low was 1.2768. The daily 38.2% Fib levels comes at 1.2818, expected to provide resistance. Similarly, the daily 61.8% fib level is at 1.2799, expected to provide support.
GBP/USD sellers prod intraday low of around 1.2810 heading into Monday’s London open, printing the first daily loss in five at the highest levels in 14 months.
In doing so, the Cable pair justifies the downside break of a bearish pennant chart formation amid downbeat signals from the MACD and the RSI (14) technical indicators.
That said, the broad US Dollar rebound amid the Juneteenth holiday, as well as backed by the hawkish Fed talks, join the Pound Sterling pair’s consolidation ahead of the Bank of England (BoE) monetary policy meeting to trigger the quote’s latest pullback from the multi-day high.
Also read: GBP/USD hovers near its highest level since April 2022, remains below mid-1.2800s
With this, the GBP/USD sellers are likely to break the 1.2800 round figure. However, a convergence of the 50-Hour Moving Average (HMA) joins two-day-old horizontal support to restrict the pair’s immediate downside near 1.2770-65.
Following that, a one-week-old rising support line and the 200-HMA, respectively near 1.2730 and 1.2600, will be crucial to watch for clear directions.
On the flip side, the Cable pair’s recovery needs validation from the 1.2850 hurdle, marked the last week.
Following that, lows printed in early April 2022 near 1.2970 may check the upside momentum targeting the 1.3000 psychological magnet.
Trend: Pullback expected
Technical Levels: Supports and Resistances
GBPUSD currently trading at 1.2817 at the time of writing. Pair opened at 1.2822 and is trading with a change of -0.04% % .
| Overview | Overview.1 | |
|---|---|---|
| 0 | Today last price | 1.2817 |
| 1 | Today Daily Change | -0.0005 |
| 2 | Today Daily Change % | -0.04% |
| 3 | Today daily open | 1.2822 |
The pair remains strongly bullish on the daily timeframe. It trades above its 20 SMA @ 1.2495, 50 SMA 1.2492, 100 SMA @ 1.2324 and 200 SMA @ 1.2045.
| Trends | Trends.1 | |
|---|---|---|
| 0 | Daily SMA20 | 1.2495 |
| 1 | Daily SMA50 | 1.2492 |
| 2 | Daily SMA100 | 1.2324 |
| 3 | Daily SMA200 | 1.2045 |
The previous day high was 1.2848 while the previous day low was 1.2768. The daily 38.2% Fib levels comes at 1.2818, expected to provide resistance. Similarly, the daily 61.8% fib level is at 1.2799, expected to provide support.
Note the levels of interest below:
- Pivot support is noted at 1.2777, 1.2733, 1.2697
- Pivot resistance is noted at 1.2857, 1.2893, 1.2937
| Levels | Levels.1 |
|---|---|
| Previous Daily High | 1.2848 |
| Previous Daily Low | 1.2768 |
| Previous Weekly High | 1.2848 |
| Previous Weekly Low | 1.2487 |
| Previous Monthly High | 1.2680 |
| Previous Monthly Low | 1.2308 |
| Daily Fibonacci 38.2% | 1.2818 |
| Daily Fibonacci 61.8% | 1.2799 |
| Daily Pivot Point S1 | 1.2777 |
| Daily Pivot Point S2 | 1.2733 |
| Daily Pivot Point S3 | 1.2697 |
| Daily Pivot Point R1 | 1.2857 |
| Daily Pivot Point R2 | 1.2893 |
| Daily Pivot Point R3 | 1.2937 |
[/s2If]
Nehcap Expert Advisor
The NEHCAP MT4 EA is high quality professional trading system geared to generate returns without using GRID or martingales. Each trade has strict risk per trade parameter. The pairs under management include EURUSD, GBPUSD, AUDCAD, AUDNZD,GBPAUD, EURAUD, EURCAD, CHFJPY and many more.
The system is trading live: LIVE ACCOUNT TRACKING
You can run it free. Apply for a free trial and track our account. Buy the system or use profit share mechanism to generate returns on your MT4.
Join Our Telegram Group
")


