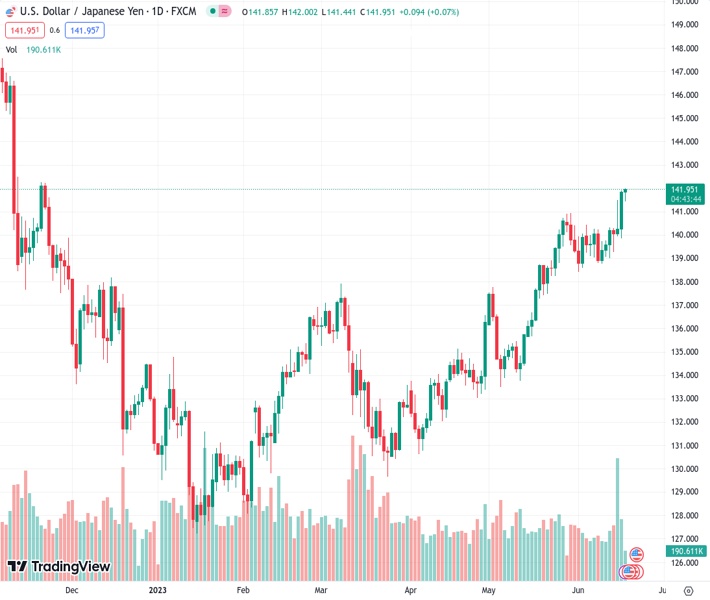
The exchange rate of USDJPY remains steady at around 141.80 after reaching its peak in November 2022.
…
This is a premium post.
[s2If !current_user_can(access_s2member_level4)]Please register for FREE REGISTER to read full post below containing analysis. In case of any error or you think you are not able to read the full post below, please email us at support#nehcap.com [lwa][/s2If] [s2If current_user_can(access_s2member_level1)]
- USD/JPY trades stable in the 141.80 area after hitting its highest point since November 2022.
The pair currently trades last at 141.830.
The previous day high was 141.92 while the previous day low was 139.85. The daily 38.2% Fib levels comes at 141.13, expected to provide support. Similarly, the daily 61.8% fib level is at 140.64, expected to provide support.
The USD/JPY slightly retreated on Monday to the 141.80 area after hitting a multi-month high on Friday. US traders are celebrating Juneteenth and markets are relatively quiet. Investors seem to be consolidating gains after the USD/JPY pair increased more than 100 pips on Friday. The week’s focus remains on economic data from the US, released throughout the next sessions, Chair Powell’s testimony before the US Congress and the Bank of Japan (BoJ) minutes out on Tuesday.
Last Wednesday, Jerome Powell stated that the Federal Reserve (Fed) opted for a hike pause, and that officials needed additional information to assess its implications on monetary policy. In that sense, US Housing data to be released on Tuesday, followed by Jobless Claims and S&P PMIs on Thursday and Friday, respectively, may impact their expectations regarding the next July meeting. In addition, Chair Powell’s testimony before Congress on Wednesday may trigger some reaction in USD price dynamics.
As for now, according to the CME FedWatch tool, investors are betting on a 75% probability of the Fed hiking by 25 basis points (bps) to the 5.25%-5.50% range on July 26.
On the other hand, the BoJ will release the minutes of its Friday meeting on Tuesday, where investors will get a better outlook of the bank’s stance regarding monetary policy that could potentially impact the Yen.
The USD/JPY has a bullish outlook in the short term, as per the daily chart. The Relative Strength Index (RSI) and Moving Average Convergence Divergence (MACD) are both in positive territory, and the pair trades above its main moving averages, indicating that the buyers are in charge.
If USD/JPY manages to move higher, the next resistances to watch are at the 142.00 zone, followed by the 142.50 area and the 143.00 zone. On the other hand, the 141.50 area is the immediate support level for USD/JPY. A break below this level could pave the way towards the 20-day Simple Moving Average (SMA) at the 139.90 area and then to the 139.20 zone.
Technical Levels: Supports and Resistances
USDJPY currently trading at 141.89 at the time of writing. Pair opened at 141.86 and is trading with a change of 0.02 % .
| Overview | Overview.1 | |
|---|---|---|
| 0 | Today last price | 141.89 |
| 1 | Today Daily Change | 0.03 |
| 2 | Today Daily Change % | 0.02 |
| 3 | Today daily open | 141.86 |
The pair remains strongly bullish on the daily timeframe. It trades above its 20 SMA @ 139.77, 50 SMA 136.91, 100 SMA @ 135.01 and 200 SMA @ 137.24.
| Trends | Trends.1 | |
|---|---|---|
| 0 | Daily SMA20 | 139.77 |
| 1 | Daily SMA50 | 136.91 |
| 2 | Daily SMA100 | 135.01 |
| 3 | Daily SMA200 | 137.24 |
The previous day high was 141.92 while the previous day low was 139.85. The daily 38.2% Fib levels comes at 141.13, expected to provide support. Similarly, the daily 61.8% fib level is at 140.64, expected to provide support.
Note the levels of interest below:
- Pivot support is noted at 140.51, 139.15, 138.44
- Pivot resistance is noted at 142.57, 143.27, 144.63
| Levels | Levels.1 |
|---|---|
| Previous Daily High | 141.92 |
| Previous Daily Low | 139.85 |
| Previous Weekly High | 141.92 |
| Previous Weekly Low | 139.01 |
| Previous Monthly High | 140.93 |
| Previous Monthly Low | 133.50 |
| Daily Fibonacci 38.2% | 141.13 |
| Daily Fibonacci 61.8% | 140.64 |
| Daily Pivot Point S1 | 140.51 |
| Daily Pivot Point S2 | 139.15 |
| Daily Pivot Point S3 | 138.44 |
| Daily Pivot Point R1 | 142.57 |
| Daily Pivot Point R2 | 143.27 |
| Daily Pivot Point R3 | 144.63 |
[/s2If]
Nehcap Expert Advisor
The NEHCAP MT4 EA is high quality professional trading system geared to generate returns without using GRID or martingales. Each trade has strict risk per trade parameter. The pairs under management include EURUSD, GBPUSD, AUDCAD, AUDNZD,GBPAUD, EURAUD, EURCAD, CHFJPY and many more.
The system is trading live: LIVE ACCOUNT TRACKING
You can run it free. Apply for a free trial and track our account. Buy the system or use profit share mechanism to generate returns on your MT4.
Join Our Telegram Group
")


