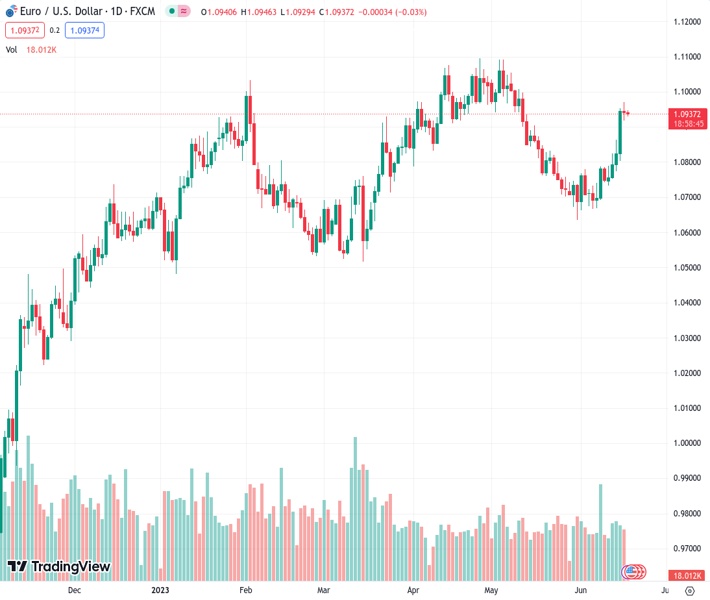
The EURUSD pair, currently trading at 1.09365, is continuing to experience a decline from its five-week high and has remained under pressure lately. However, it is predicted that the downside will be limited according to the perspective of @nehcap.
…
This is a premium post.
[s2If !current_user_can(access_s2member_level4)]Please register for FREE REGISTER to read full post below containing analysis. In case of any error or you think you are not able to read the full post below, please email us at support#nehcap.com [lwa][/s2If] [s2If current_user_can(access_s2member_level1)]
- EUR/USD extends previous day’s pullback from five-week high, stays pressured of late.
The pair currently trades last at 1.09365.
The previous day high was 1.0971 while the previous day low was 1.0918. The daily 38.2% Fib levels comes at 1.0938, expected to provide resistance. Similarly, the daily 61.8% fib level is at 1.095, expected to provide resistance.
EUR/USD takes offers to reverse the late Friday’s corrective bounce, as well as the week-start inaction, as it justifies the previous day’s bearish candlestick formation amid overbought RSI conditions on early Monday in Europe. That said, the Euro pair renews its intraday low near 1.0930 while extending earlier pullback from the highest levels in five weeks.
It’s worth noting that the Juneteenth holiday in the US also joins the bearish spinning top candlestick on the daily chart of the EUR/USD pair and the overbought RSI (14) line to please the Euro bears of late.
With this, the quote appears all set to decline towards a nine-week-old horizontal support zone surrounding 1.0910-900.
However, the bullish MACD signals and the 50-DMA support of around 1.0880 can challenge the EUR/USD bears afterward.
In a case where the Euro pair drops below 1.0880, the odds of witnessing a slump towards the 50% and 61.8% Fibonacci retracement of its March-April run-up, respectively near 1.0800 and 1.0735, can’t be ruled out.
On the flip side, a daily closing beyond the 23.6% Fibonacci retracement of near 1.0960 and the previous day’s peak of around 1.0970 restrict the short-term EUR/USD upside.
Following that, multiple tops marked around 1.1000 can challenge the Euro bulls before directing them to the March 2022 high close to 1. 1185.
Trend: Limited downside expected
Technical Levels: Supports and Resistances
EURUSD currently trading at 1.0936 at the time of writing. Pair opened at 1.094 and is trading with a change of -0.04% % .
| Overview | Overview.1 | |
|---|---|---|
| 0 | Today last price | 1.0936 |
| 1 | Today Daily Change | -0.0004 |
| 2 | Today Daily Change % | -0.04% |
| 3 | Today daily open | 1.094 |
The pair remains strongly bullish on the daily timeframe. It trades above its 20 SMA @ 1.0764, 50 SMA 1.0879, 100 SMA @ 1.0807 and 200 SMA @ 1.0542.
| Trends | Trends.1 | |
|---|---|---|
| 0 | Daily SMA20 | 1.0764 |
| 1 | Daily SMA50 | 1.0879 |
| 2 | Daily SMA100 | 1.0807 |
| 3 | Daily SMA200 | 1.0542 |
The previous day high was 1.0971 while the previous day low was 1.0918. The daily 38.2% Fib levels comes at 1.0938, expected to provide resistance. Similarly, the daily 61.8% fib level is at 1.095, expected to provide resistance.
Note the levels of interest below:
- Pivot support is noted at 1.0915, 1.089, 1.0862
- Pivot resistance is noted at 1.0968, 1.0996, 1.1021
| Levels | Levels.1 |
|---|---|
| Previous Daily High | 1.0971 |
| Previous Daily Low | 1.0918 |
| Previous Weekly High | 1.0971 |
| Previous Weekly Low | 1.0733 |
| Previous Monthly High | 1.1092 |
| Previous Monthly Low | 1.0635 |
| Daily Fibonacci 38.2% | 1.0938 |
| Daily Fibonacci 61.8% | 1.0950 |
| Daily Pivot Point S1 | 1.0915 |
| Daily Pivot Point S2 | 1.0890 |
| Daily Pivot Point S3 | 1.0862 |
| Daily Pivot Point R1 | 1.0968 |
| Daily Pivot Point R2 | 1.0996 |
| Daily Pivot Point R3 | 1.1021 |
[/s2If]
Nehcap Expert Advisor
The NEHCAP MT4 EA is high quality professional trading system geared to generate returns without using GRID or martingales. Each trade has strict risk per trade parameter. The pairs under management include EURUSD, GBPUSD, AUDCAD, AUDNZD,GBPAUD, EURAUD, EURCAD, CHFJPY and many more.
The system is trading live: LIVE ACCOUNT TRACKING
You can run it free. Apply for a free trial and track our account. Buy the system or use profit share mechanism to generate returns on your MT4.
Join Our Telegram Group
")


