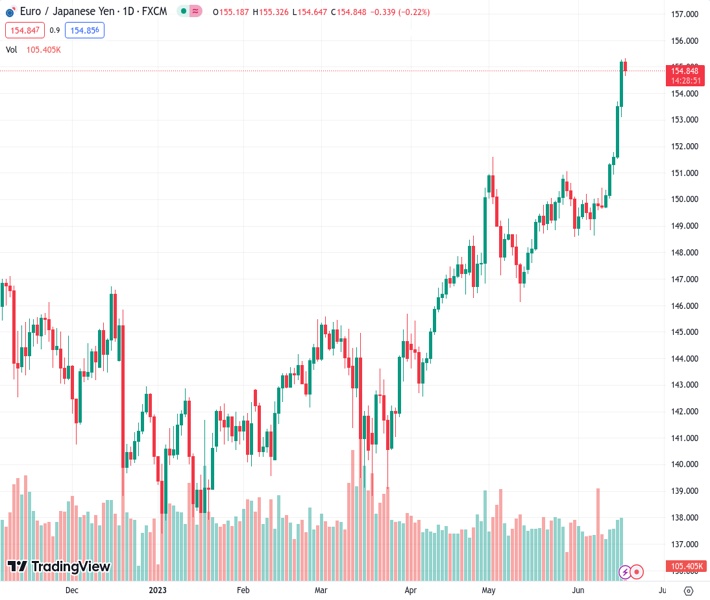
The EURJPY pair, which reached its highest levels since September 2008, has experienced its first daily loss in six days as it falls to 154.784. However, it is predicted that the downward trend will not be significant. This is the opinion of @nehcap.
…
This is a premium post.
[s2If !current_user_can(access_s2member_level4)]Please register for FREE REGISTER to read full post below containing analysis. In case of any error or you think you are not able to read the full post below, please email us at support#nehcap.com [lwa][/s2If] [s2If current_user_can(access_s2member_level1)]
- EUR/JPY prints the first daily loss in six as it retreats from the highest levels since September 2008.
The pair currently trades last at 154.784.
The previous day high was 155.27 while the previous day low was 153.09. The daily 38.2% Fib levels comes at 154.44, expected to provide support. Similarly, the daily 61.8% fib level is at 153.93, expected to provide support.
EUR/JPY pares intraday losses within a short-term bullish channel as it prints the first daily fall in six. In doing so, the cross-currency pair retreats from the highest levels since September 2008, marked the previous day, to lure the sellers amid sluggish markets due to the US holiday.
That said, the quote formed a bearish Doji candlestick at the multi-year high while challenging a three-day-old ascending trend channel bullish chart pattern.
It’s worth noting that the placement of the Doji near the highest levels in many months joins the overbought RSI conditions and a looming bear cross on the MACD indicator to suggest a consolidation of the latest gains by the EUR/JPY pair.
However, a clear downside break of the stated bullish channel’s bottom line, close to 154.80 at the latest, becomes necessary for the pair sellers to retake control.
Even so, a convergence of the 50-SMA and a rising trend line from June 07, close to 151.50-45, appears a tough nut to crack for the EUR/JPY bears.
Meanwhile, EUR/JPY rebound may initially aim for the latest peak of around 155.30 ahead of challenging the stated bullish channel’s peak of around 156.10.
Following that, the September 2008 peak of around 156.85 and the 160.00 round figure will be in the spotlight.
Overall, EUR/JPY remains bullish despite the latest signals suggesting a pullback in the prices.
Trend: Limited downside expected
Technical Levels: Supports and Resistances
EURJPY currently trading at 154.92 at the time of writing. Pair opened at 155.21 and is trading with a change of -0.19% % .
| Overview | Overview.1 | |
|---|---|---|
| 0 | Today last price | 154.92 |
| 1 | Today Daily Change | -0.29 |
| 2 | Today Daily Change % | -0.19% |
| 3 | Today daily open | 155.21 |
The pair remains strongly bullish on the daily timeframe. It trades above its 20 SMA @ 150.45, 50 SMA 148.91, 100 SMA @ 145.89 and 200 SMA @ 144.5.
| Trends | Trends.1 | |
|---|---|---|
| 0 | Daily SMA20 | 150.45 |
| 1 | Daily SMA50 | 148.91 |
| 2 | Daily SMA100 | 145.89 |
| 3 | Daily SMA200 | 144.50 |
The previous day high was 155.27 while the previous day low was 153.09. The daily 38.2% Fib levels comes at 154.44, expected to provide support. Similarly, the daily 61.8% fib level is at 153.93, expected to provide support.
Note the levels of interest below:
- Pivot support is noted at 153.78, 152.34, 151.59
- Pivot resistance is noted at 155.96, 156.71, 158.14
| Levels | Levels.1 |
|---|---|
| Previous Daily High | 155.27 |
| Previous Daily Low | 153.09 |
| Previous Weekly High | 155.27 |
| Previous Weekly Low | 149.67 |
| Previous Monthly High | 151.62 |
| Previous Monthly Low | 146.14 |
| Daily Fibonacci 38.2% | 154.44 |
| Daily Fibonacci 61.8% | 153.93 |
| Daily Pivot Point S1 | 153.78 |
| Daily Pivot Point S2 | 152.34 |
| Daily Pivot Point S3 | 151.59 |
| Daily Pivot Point R1 | 155.96 |
| Daily Pivot Point R2 | 156.71 |
| Daily Pivot Point R3 | 158.14 |
[/s2If]
Nehcap Expert Advisor
The NEHCAP MT4 EA is high quality professional trading system geared to generate returns without using GRID or martingales. Each trade has strict risk per trade parameter. The pairs under management include EURUSD, GBPUSD, AUDCAD, AUDNZD,GBPAUD, EURAUD, EURCAD, CHFJPY and many more.
The system is trading live: LIVE ACCOUNT TRACKING
You can run it free. Apply for a free trial and track our account. Buy the system or use profit share mechanism to generate returns on your MT4.
Join Our Telegram Group
")


