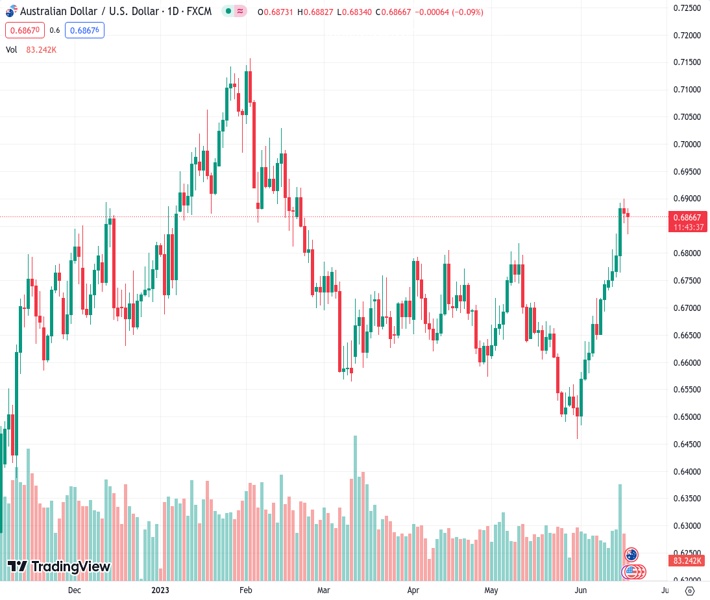
The AUDUSD pair has decreased for two consecutive days, but the decline is restricted in nature.
…
This is a premium post.
[s2If !current_user_can(access_s2member_level4)]Please register for FREE REGISTER to read full post below containing analysis. In case of any error or you think you are not able to read the full post below, please email us at support#nehcap.com [lwa][/s2If] [s2If current_user_can(access_s2member_level1)]
- AUD/USD drifts lower for the second straight day, though the downside remains limited.
The pair currently trades last at 0.68677.
The previous day high was 0.69 while the previous day low was 0.6855. The daily 38.2% Fib levels comes at 0.6872, expected to provide resistance. Similarly, the daily 61.8% fib level is at 0.6883, expected to provide resistance.
The AUD/USD pair attracts some dip-buying on the first day of a new week and stalls its pullback from the 0.6900 mark, or the highest level since February 2023 touched on Friday. Spot prices, however, remain in the negative territory for the second straight day and trade around the 0.6865 region during the early European session.
The Federal Reserve’s (Fed) hawkish outlook, signalling that borrowing costs may still need to rise by as much as 50 bps by the end of this year, assists the US Dollar (USD) to gain some positive traction on Monday. Apart from this, a generally softer risk tone, amid worries about a global economic downturn, particularly in China, further benefits the safe-haven buck and weighs on the risk-sensitive Aussie. That said, the Reserve Bank of Australia’s (RBA) surprise 25 bps rate hike and a more hawkish policy statement, act as a tailwind for the Australian Dollar and help limit losses for the AUD/USD pair.
From a technical perspective, last week’s breakout through the 100-day Simple Moving Average (SMA) and a subsequent move beyond the 0.6800 round-figure mark was seen as a fresh trigger for bulls. That said, the Relative Strength Index (RSI) on the daily chart is hovering around the 70 mark and holding back traders from placing fresh bullish bets around the AUD/USD pair. Nevertheless, the aforementioned fundamental backdrop suggests that the path of least resistance for spot prices is to the downside and any corrective decline might attract fresh buyers near the 0.6800 resistance breakpoint.
That said, a sustained break below the latter might prompt some technical selling and drag the AUD/USD pair back towards the 100-day SMA, currently pegged around the 0.6725 region. The said area should act as a key pivotal point and a strong near-term base for spot prices, which if broken should pave the way for deeper losses.
On the flip side, the 0.6900 round-figure mark now seems to have emerged as an immediate hurdle. Some follow-through buying has the potential to lift the AUD/USD pair further towards the 0.6955-0.6960 region, above which bulls might aim to conquer the 0.7000 psychological mark for the first time since February 14.
Technical Levels: Supports and Resistances
AUDUSD currently trading at 0.6868 at the time of writing. Pair opened at 0.6876 and is trading with a change of -0.12 % .
| Overview | Overview.1 | |
|---|---|---|
| 0 | Today last price | 0.6868 |
| 1 | Today Daily Change | -0.0008 |
| 2 | Today Daily Change % | -0.1200 |
| 3 | Today daily open | 0.6876 |
The pair remains strongly bullish on the daily timeframe. It trades above its 20 SMA @ 0.6652, 50 SMA 0.6672, 100 SMA @ 0.6728 and 200 SMA @ 0.6692.
| Trends | Trends.1 | |
|---|---|---|
| 0 | Daily SMA20 | 0.6652 |
| 1 | Daily SMA50 | 0.6672 |
| 2 | Daily SMA100 | 0.6728 |
| 3 | Daily SMA200 | 0.6692 |
The previous day high was 0.69 while the previous day low was 0.6855. The daily 38.2% Fib levels comes at 0.6872, expected to provide resistance. Similarly, the daily 61.8% fib level is at 0.6883, expected to provide resistance.
Note the levels of interest below:
- Pivot support is noted at 0.6854, 0.6832, 0.6809
- Pivot resistance is noted at 0.6898, 0.6921, 0.6943
| Levels | Levels.1 |
|---|---|
| Previous Daily High | 0.6900 |
| Previous Daily Low | 0.6855 |
| Previous Weekly High | 0.6900 |
| Previous Weekly Low | 0.6732 |
| Previous Monthly High | 0.6818 |
| Previous Monthly Low | 0.6458 |
| Daily Fibonacci 38.2% | 0.6872 |
| Daily Fibonacci 61.8% | 0.6883 |
| Daily Pivot Point S1 | 0.6854 |
| Daily Pivot Point S2 | 0.6832 |
| Daily Pivot Point S3 | 0.6809 |
| Daily Pivot Point R1 | 0.6898 |
| Daily Pivot Point R2 | 0.6921 |
| Daily Pivot Point R3 | 0.6943 |
[/s2If]
Nehcap Expert Advisor
The NEHCAP MT4 EA is high quality professional trading system geared to generate returns without using GRID or martingales. Each trade has strict risk per trade parameter. The pairs under management include EURUSD, GBPUSD, AUDCAD, AUDNZD,GBPAUD, EURAUD, EURCAD, CHFJPY and many more.
The system is trading live: LIVE ACCOUNT TRACKING
You can run it free. Apply for a free trial and track our account. Buy the system or use profit share mechanism to generate returns on your MT4.
Join Our Telegram Group
")


