The AUDJPY currency pair, currently at 97.2130, is experiencing a decline due to a prevailing negative market sentiment caused by central banks expressing hawkish views.
…
This is a premium post.
[s2If !current_user_can(access_s2member_level4)]Please register for FREE REGISTER to read full post below containing analysis. In case of any error or you think you are not able to read the full post below, please email us at support#nehcap.com [lwa][/s2If] [s2If current_user_can(access_s2member_level1)]
- AUD/JPY is on a downward trajectory as a global risk-off mood sets in, influenced by hawkish central banks.
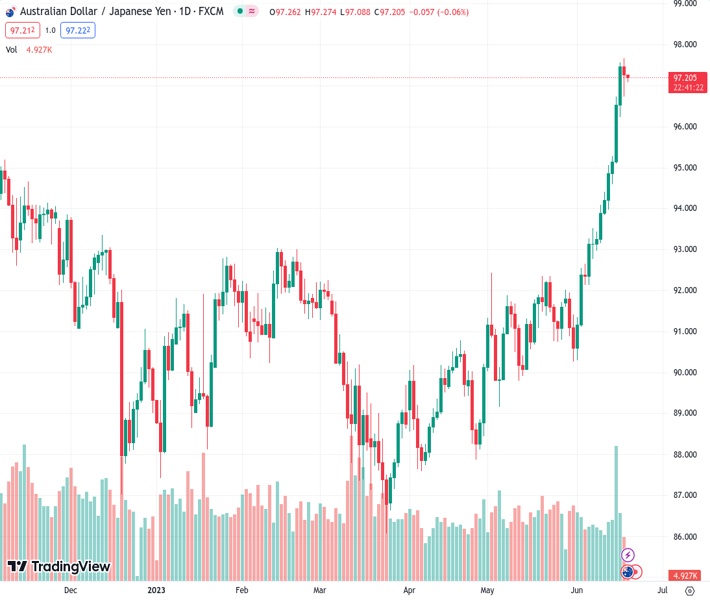
The pair currently trades last at 97.2130.
The previous day high was 97.63 while the previous day low was 96.24. The daily 38.2% Fib levels comes at 97.1, expected to provide support. Similarly, the daily 61.8% fib level is at 96.77, expected to provide support.
As the Asian session begins, the AUD/JPY is poised to extend its losses past Monday’s close of 97.26 amidst a risk-off impulse. Expectations of further tightening by global central banks, and hawkish Fed dot plots, weighed on investors’ mood. At the time of writing, the AUD/JPY is trading at 97.20, down by 0.06%.
Following a steep rally in early June that totaled an 8% gain, the AUD/JPY could be set for a pullback as oscillators entered the overbought territory, with the Relative Strength Index (RSI) indicator hitting 80. Since then, the RSI started to trend lower, while the AUD/JPY retreated from year-to-date (YTD) highs of 97.67.
If AUD/JPY slides below the June 19 low of 96.73, the next support would be the June 16 low of 96.24. A breach of the latter will expose the 96.00 figure, followed by the Tenkan-Sen at 95.32. Conversely, AUG/JPY’s first resistance would be the YTD high at 97.67. Break above will expose the 98.00 figure
Technical Levels: Supports and Resistances
AUDJPY currently trading at 97.2 at the time of writing. Pair opened at 97.56 and is trading with a change of -0.37 % .
| Overview | Overview.1 | |
|---|---|---|
| 0 | Today last price | 97.20 |
| 1 | Today Daily Change | -0.36 |
| 2 | Today Daily Change % | -0.37 |
| 3 | Today daily open | 97.56 |
The pair remains strongly bullish on the daily timeframe. It trades above its 20 SMA @ 92.98, 50 SMA 91.34, 100 SMA @ 90.82 and 200 SMA @ 91.75.
| Trends | Trends.1 | |
|---|---|---|
| 0 | Daily SMA20 | 92.98 |
| 1 | Daily SMA50 | 91.34 |
| 2 | Daily SMA100 | 90.82 |
| 3 | Daily SMA200 | 91.75 |
The previous day high was 97.63 while the previous day low was 96.24. The daily 38.2% Fib levels comes at 97.1, expected to provide support. Similarly, the daily 61.8% fib level is at 96.77, expected to provide support.
Note the levels of interest below:
- Pivot support is noted at 96.66, 95.76, 95.27
- Pivot resistance is noted at 98.05, 98.53, 99.44
| Levels | Levels.1 |
|---|---|
| Previous Daily High | 97.63 |
| Previous Daily Low | 96.24 |
| Previous Weekly High | 97.63 |
| Previous Weekly Low | 93.88 |
| Previous Monthly High | 92.44 |
| Previous Monthly Low | 89.16 |
| Daily Fibonacci 38.2% | 97.10 |
| Daily Fibonacci 61.8% | 96.77 |
| Daily Pivot Point S1 | 96.66 |
| Daily Pivot Point S2 | 95.76 |
| Daily Pivot Point S3 | 95.27 |
| Daily Pivot Point R1 | 98.05 |
| Daily Pivot Point R2 | 98.53 |
| Daily Pivot Point R3 | 99.44 |
[/s2If]
Nehcap Expert Advisor
The NEHCAP MT4 EA is high quality professional trading system geared to generate returns without using GRID or martingales. Each trade has strict risk per trade parameter. The pairs under management include EURUSD, GBPUSD, AUDCAD, AUDNZD,GBPAUD, EURAUD, EURCAD, CHFJPY and many more.
The system is trading live: LIVE ACCOUNT TRACKING
You can run it free. Apply for a free trial and track our account. Buy the system or use profit share mechanism to generate returns on your MT4.
Join Our Telegram Group
")


