The AUD/USD pair at a rate of 0.68470 has experienced a drop close to 0.6840 during a subdued market atmosphere because of an extended holiday weekend in the US.
…
This is a premium post.
[s2If !current_user_can(access_s2member_level4)]Please register for FREE REGISTER to read full post below containing analysis. In case of any error or you think you are not able to read the full post below, please email us at support#nehcap.com [lwa][/s2If] [s2If current_user_can(access_s2member_level1)]
- AUD/USD has shown a downside move to near 0.6840 amid a quiet market mood due to an extended weekend in the US.
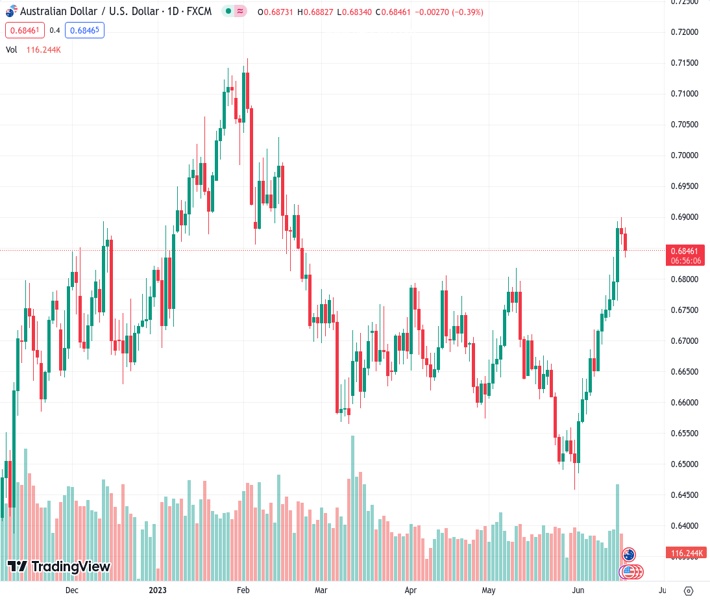
The pair currently trades last at 0.68470.
The previous day high was 0.69 while the previous day low was 0.6855. The daily 38.2% Fib levels comes at 0.6872, expected to provide resistance. Similarly, the daily 61.8% fib level is at 0.6883, expected to provide resistance.
The AUD/USD pair has retreated after facing barricades around 0.6880 in the European session. The Aussie asset has dropped to near 0.6840 as investors are getting precautionary ahead of the release of the Reserve Bank of Australia (RBA) minutes and the monetary policy announcement by the People’s Bank of China (PBoC).
The US Dollar Index (DXY) is demonstrating a lackluster performance as United States markets are closed on Monday on account of Juneteenth.
Meanwhile, US Treasury yields have extended further as the Federal Reserve (Fed) has confirmed expansion in interest rates by 50 basis points (bps) to 5.50-5.75%. The 10-year US Treasury yields have jumped to 3.82%.
AUD/USD is climbing higher in a Rising Channel chart pattern formed on an hourly scale in which each pullback is considered as a buying opportunity. The Aussie has tested territory below the aforementioned pattern but is finding cushion near the horizontal support plotted from June 14 high at 0.6834.
Upward-sloping 100-period Exponential Moving Average (EMA) at 0.6826 indicates that the trend is bullish.
The Relative Strength Index (RSI) (14) is taking support near 40.00. A recovery move above 60.00 would strengthen the upside momentum.
A decisive break above the round-level resistance of 0.6900 will drive the asset toward Feb 16 high at 0.6936 followed by Feb 07 high at 0.6988.
On the flip side, a breakdown below June 14 low at 0.6756 will expose the Aussie asset to May 02 high at 0.6717 and May 19 high at 0.6675.
Technical Levels: Supports and Resistances
AUDUSD currently trading at 0.685 at the time of writing. Pair opened at 0.6876 and is trading with a change of -0.38 % .
| Overview | Overview.1 | |
|---|---|---|
| 0 | Today last price | 0.6850 |
| 1 | Today Daily Change | -0.0026 |
| 2 | Today Daily Change % | -0.3800 |
| 3 | Today daily open | 0.6876 |
The pair remains strongly bullish on the daily timeframe. It trades above its 20 SMA @ 0.6652, 50 SMA 0.6672, 100 SMA @ 0.6728 and 200 SMA @ 0.6692.
| Trends | Trends.1 | |
|---|---|---|
| 0 | Daily SMA20 | 0.6652 |
| 1 | Daily SMA50 | 0.6672 |
| 2 | Daily SMA100 | 0.6728 |
| 3 | Daily SMA200 | 0.6692 |
The previous day high was 0.69 while the previous day low was 0.6855. The daily 38.2% Fib levels comes at 0.6872, expected to provide resistance. Similarly, the daily 61.8% fib level is at 0.6883, expected to provide resistance.
Note the levels of interest below:
- Pivot support is noted at 0.6854, 0.6832, 0.6809
- Pivot resistance is noted at 0.6898, 0.6921, 0.6943
| Levels | Levels.1 |
|---|---|
| Previous Daily High | 0.6900 |
| Previous Daily Low | 0.6855 |
| Previous Weekly High | 0.6900 |
| Previous Weekly Low | 0.6732 |
| Previous Monthly High | 0.6818 |
| Previous Monthly Low | 0.6458 |
| Daily Fibonacci 38.2% | 0.6872 |
| Daily Fibonacci 61.8% | 0.6883 |
| Daily Pivot Point S1 | 0.6854 |
| Daily Pivot Point S2 | 0.6832 |
| Daily Pivot Point S3 | 0.6809 |
| Daily Pivot Point R1 | 0.6898 |
| Daily Pivot Point R2 | 0.6921 |
| Daily Pivot Point R3 | 0.6943 |
[/s2If]
Nehcap Expert Advisor
The NEHCAP MT4 EA is high quality professional trading system geared to generate returns without using GRID or martingales. Each trade has strict risk per trade parameter. The pairs under management include EURUSD, GBPUSD, AUDCAD, AUDNZD,GBPAUD, EURAUD, EURCAD, CHFJPY and many more.
The system is trading live: LIVE ACCOUNT TRACKING
You can run it free. Apply for a free trial and track our account. Buy the system or use profit share mechanism to generate returns on your MT4.
Join Our Telegram Group
")


