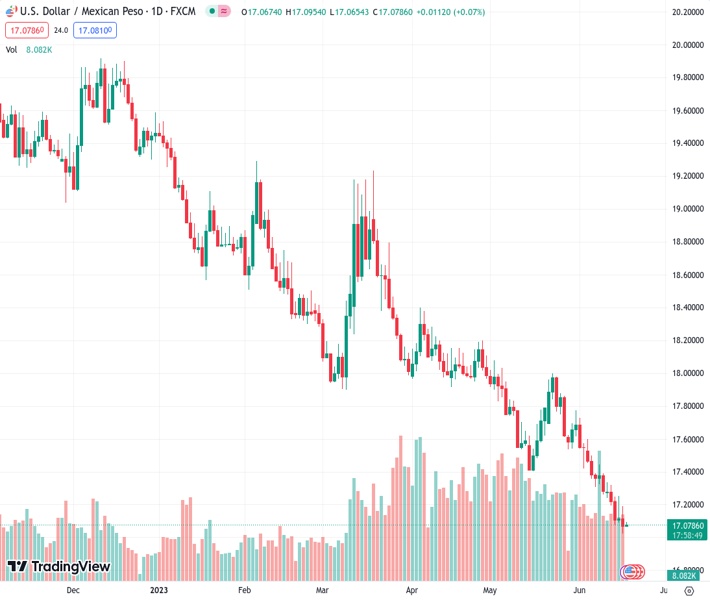
Starting the new week in a upbeat manner, the US dollar to Mexican peso exchange rate rose above a multi-year low at 17.0784.
…
This is a premium post.
[s2If !current_user_can(access_s2member_level4)]Please register for FREE REGISTER to read full post below containing analysis. In case of any error or you think you are not able to read the full post below, please email us at support#nehcap.com [lwa][/s2If] [s2If current_user_can(access_s2member_level1)]
- USD/MXN kicks off the new week on a positive note and moves away from a multi-year low.
The pair currently trades last at 17.0784.
The previous day high was 17.1894 while the previous day low was 17.0243. The daily 38.2% Fib levels comes at 17.0874, expected to provide resistance. Similarly, the daily 61.8% fib level is at 17.1264, expected to provide resistance.
The USD/MXN pair edges higher during the Asian session on Monday, albeit lacks bullish conviction and remains well within the striking distance of its lowest level since December 2015. The pair currently trades around the 17.0915-17.0920 region, up just over 0.10% for the day, and so far, has managed to defend support marked by the lower boundary of a nearly one-month-old descending channel.
From a technical perspective, the Relative Strength Index (RSI) on the daily chart is flashing oversold conditions and holding back traders from placing fresh bearish bets around the USD/MXN pair. That said, the lack of any meaningful buying suggests that a multi-month-old downtrend is still far from being over. Hence, any attempted recovery move could attract fresh sellers near the 17.2550 area, which coincides with the 50-period Simple Moving Average (SMA) on the 4-hour chart.
This, in turn, should cap the USD/MXN pair near the trend-channel resistance, currently pegged around the 17.2600 round-figure mark, which should now act as a pivotal point for short-term traders. A convincing break through the said barrier will suggest that the USD/MXN pair has formed a near-term bottom and pave the way for a further appreciating move towards last week’s swing high, around the 17.3345 area.
On the flip side, the multi-year low, around the 17.0245-17.0240 area touched on Friday, now seems to protect the immediate downside ahead of the trend-channel support, currently around the 17.0000 psychological mark. A convincing break below the latter will mark a fresh bearish breakdown and set the stage for an extension of the recent well-established bearish trend witnessed over the past three months or so.
Technical Levels: Supports and Resistances
USDMXN currently trading at 17.0836 at the time of writing. Pair opened at 17.0738 and is trading with a change of 0.06 % .
| Overview | Overview.1 | |
|---|---|---|
| 0 | Today last price | 17.0836 |
| 1 | Today Daily Change | 0.0098 |
| 2 | Today Daily Change % | 0.0600 |
| 3 | Today daily open | 17.0738 |
The pair remains strongly bearish on the daily time frame. It trades below the 20 SMA @ 17.4948, 50 SMA 17.7314, 100 SMA @ 18.1001 and 200 SMA @ 18.8469.
| Trends | Trends.1 | |
|---|---|---|
| 0 | Daily SMA20 | 17.4948 |
| 1 | Daily SMA50 | 17.7314 |
| 2 | Daily SMA100 | 18.1001 |
| 3 | Daily SMA200 | 18.8469 |
The previous day high was 17.1894 while the previous day low was 17.0243. The daily 38.2% Fib levels comes at 17.0874, expected to provide resistance. Similarly, the daily 61.8% fib level is at 17.1264, expected to provide resistance.
Note the levels of interest below:
- Pivot support is noted at 17.0022, 16.9307, 16.8371
- Pivot resistance is noted at 17.1674, 17.261, 17.3325
| Levels | Levels.1 |
|---|---|
| Previous Daily High | 17.1894 |
| Previous Daily Low | 17.0243 |
| Previous Weekly High | 17.3353 |
| Previous Weekly Low | 17.0243 |
| Previous Monthly High | 18.0780 |
| Previous Monthly Low | 17.4203 |
| Daily Fibonacci 38.2% | 17.0874 |
| Daily Fibonacci 61.8% | 17.1264 |
| Daily Pivot Point S1 | 17.0022 |
| Daily Pivot Point S2 | 16.9307 |
| Daily Pivot Point S3 | 16.8371 |
| Daily Pivot Point R1 | 17.1674 |
| Daily Pivot Point R2 | 17.2610 |
| Daily Pivot Point R3 | 17.3325 |
[/s2If]
Nehcap Expert Advisor
The NEHCAP MT4 EA is high quality professional trading system geared to generate returns without using GRID or martingales. Each trade has strict risk per trade parameter. The pairs under management include EURUSD, GBPUSD, AUDCAD, AUDNZD,GBPAUD, EURAUD, EURCAD, CHFJPY and many more.
The system is trading live: LIVE ACCOUNT TRACKING
You can run it free. Apply for a free trial and track our account. Buy the system or use profit share mechanism to generate returns on your MT4.
Join Our Telegram Group
")


