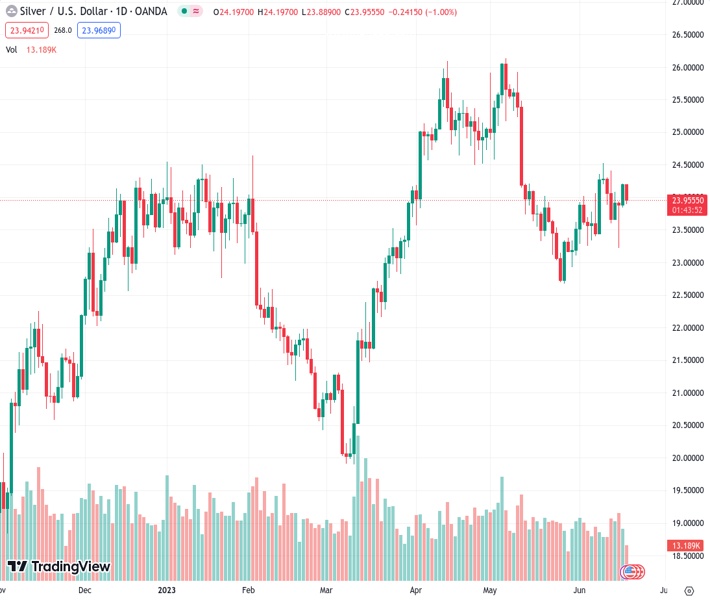
Silver, represented by #XAGUSD, has decreased by over 1% and is facing difficulty in maintaining a position above the intersection of the 50 and 20-day EMAs at the price range of $23.86 to $23.92.
…
This is a premium post.
[s2If !current_user_can(access_s2member_level4)]Please register for FREE REGISTER to read full post below containing analysis. In case of any error or you think you are not able to read the full post below, please email us at support#nehcap.com [lwa][/s2If] [s2If current_user_can(access_s2member_level1)]
- Silver is down by more than 1%, struggling to stay above the confluence of 50 and 20-day EMAs at $23.86/92.
The pair currently trades last at 23.953.
The previous day high was 24.21 while the previous day low was 23.84. The daily 38.2% Fib levels comes at 24.07, expected to provide resistance. Similarly, the daily 61.8% fib level is at 23.98, expected to provide resistance.
Silver price retraces from last Friday’s highs of $24.20, down more than 1%, as sellers look to get XAG/USD price below the confluence of the 50 and 20-day ExponentialMoving Averages (EMAs) at around $23.86/92. At the time of writing, the XAG/USD is trading at $23.92.
The XAG/USD remains neutral to downward biased after slipping past support at the April 29 swing low of $24.49, a price level tested four times last month. However, buyers’ failure to crack that level exposed XAG/USD to selling pressure, witnessed by Monday’s price action as Silver collided with resistance at a downslope trendline drawn from year-to-date (YTD) highs of $26.13 that passes at around the $24.20/30 area.
In addition, the Relative Strength Index (RSI) indicator aims lower, about to pierce below the 50-midline, a bearish signal, while the three-day Rate of Change (RoC) sees the latest spike, well below the last three upside days, suggesting that buying pressure is fading.
Therefore, the XAG/USD path of least resistance is downwards. The first support would be the confluence of the 50 and 20-day EMAs at the $23.86/92 range. A breach of the latter will expose the 100-day EMA at $23.55, followed by the $23.00 figure ahead of the 200-day EMA at $22.96. Conversely, the XAG/USD first resistance would be the $24.00 threshold, ahead of April’s 29 low turned resistance at around $24.49.
Technical Levels: Supports and Resistances
XAGUSD currently trading at 23.95 at the time of writing. Pair opened at 24.2 and is trading with a change of -1.03 % .
| Overview | Overview.1 | |
|---|---|---|
| 0 | Today last price | 23.95 |
| 1 | Today Daily Change | -0.25 |
| 2 | Today Daily Change % | -1.03 |
| 3 | Today daily open | 24.20 |
The pair is trading above its 20 Daily moving average @ 23.63, below its 50 Daily moving average @ 24.43 , above its 100 Daily moving average @ 23.36 and above its 200 Daily moving average @ 22.4
| Trends | Trends.1 | |
|---|---|---|
| 0 | Daily SMA20 | 23.63 |
| 1 | Daily SMA50 | 24.43 |
| 2 | Daily SMA100 | 23.36 |
| 3 | Daily SMA200 | 22.40 |
The previous day high was 24.21 while the previous day low was 23.84. The daily 38.2% Fib levels comes at 24.07, expected to provide resistance. Similarly, the daily 61.8% fib level is at 23.98, expected to provide resistance.
Note the levels of interest below:
- Pivot support is noted at 23.96, 23.71, 23.58
- Pivot resistance is noted at 24.33, 24.46, 24.7
| Levels | Levels.1 |
|---|---|
| Previous Daily High | 24.21 |
| Previous Daily Low | 23.84 |
| Previous Weekly High | 24.40 |
| Previous Weekly Low | 23.22 |
| Previous Monthly High | 26.14 |
| Previous Monthly Low | 22.68 |
| Daily Fibonacci 38.2% | 24.07 |
| Daily Fibonacci 61.8% | 23.98 |
| Daily Pivot Point S1 | 23.96 |
| Daily Pivot Point S2 | 23.71 |
| Daily Pivot Point S3 | 23.58 |
| Daily Pivot Point R1 | 24.33 |
| Daily Pivot Point R2 | 24.46 |
| Daily Pivot Point R3 | 24.70 |
[/s2If]
Nehcap Expert Advisor
The NEHCAP MT4 EA is high quality professional trading system geared to generate returns without using GRID or martingales. Each trade has strict risk per trade parameter. The pairs under management include EURUSD, GBPUSD, AUDCAD, AUDNZD,GBPAUD, EURAUD, EURCAD, CHFJPY and many more.
The system is trading live: LIVE ACCOUNT TRACKING
You can run it free. Apply for a free trial and track our account. Buy the system or use profit share mechanism to generate returns on your MT4.
Join Our Telegram Group
")


