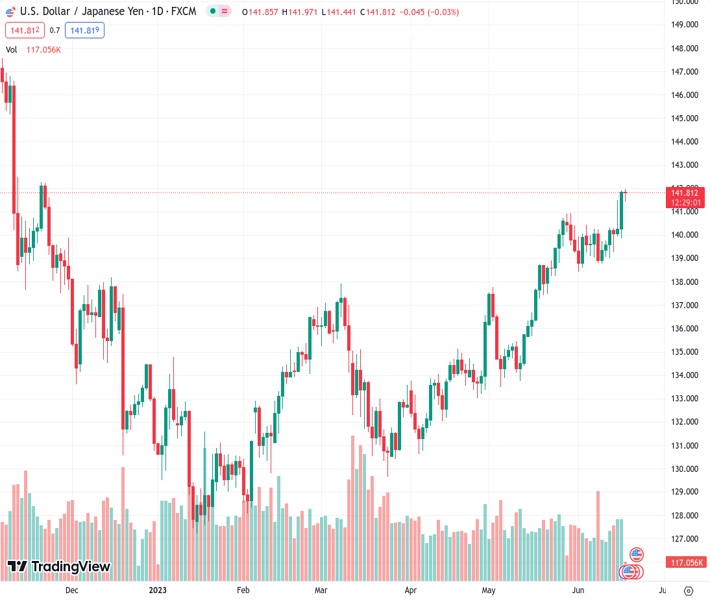
On Monday, the USDJPY reached a new high for the year at 141.792, but did not fully take advantage of the increase.
…
This is a premium post.
[s2If !current_user_can(access_s2member_level4)]Please register for FREE REGISTER to read full post below containing analysis. In case of any error or you think you are not able to read the full post below, please email us at support#nehcap.com [lwa][/s2If] [s2If current_user_can(access_s2member_level1)]
- USD/JPY touches a fresh YTD peak on Monday, albeit struggles to capitalize on the move.
The pair currently trades last at 141.792.
The previous day high was 141.92 while the previous day low was 139.85. The daily 38.2% Fib levels comes at 141.13, expected to provide support. Similarly, the daily 61.8% fib level is at 140.64, expected to provide support.
The USD/JPY pair reverses an intraday dip to the 141.45 area and steadily climbs back closer to its highest level since November 2022 touched earlier this Monday. Spot prices trade just below the 142.00 mark during the early European session and seem poised to prolong the recent well-established bullish trajectory witnessed over the past three months or so.
The Japanese (JPY) continues to be weighed down by a big divergence in the monetary policy stance adopted by the Bank of Japan (BoJ) and other major central banks, including the US Federal Reserve (Fed). This, along with a modest US Dollar (USD) strength, acts as a tailwind for the USD/JPY pair on the first day of a new week, though slightly overstretched conditions hold back bulls from placing fresh bets and capping the upside.
It is worth recalling that the BoJ on Friday held its short-term interest rate target at -0.1% and made no changes to its yield curve control policy. The BoJ also kept intact its view that inflation will slow later this year, underscoring its focus on supporting a fragile economic recovery on the back of global uncertainty. In contrast, the US central bank, albeit decided to leave its interest rates unchanged, signalled that borrowing costs may still need to rise by as much as 50 bps by the end of this year. This, in turn, is seen lending some support to the Greenback and the USD/JPY pair.
That said, the incoming softer US macro data raised questions over how much headroom the US central bank has to keep raising rates and fueled speculations that the Fed is nearing the end of its policy tightening cycle. This, along with worries about a global economic downturn and a softer risk tone, lends some support to the safe-haven JPY. Apart from this, thin trading volumes on the back of a US bank holiday warrant some caution before placing aggressive bullish bets ahead of Fed Chair Jerome Powell’s two-day congressional testimony on Wednesday and Thursday.
Investors will closely scrutinize Powell’s remarks for clues about the future rate-hike path, which will play a key role in influencing the near-term USD price dynamics and provide a fresh directional impetus to the USD/JPY pair. Nevertheless, the aforementioned fundamental backdrop suggests that the path of least resistance for spot prices is to the upside. Hence, any corrective decline is more likely to attract fresh buyers and remain limited.
Technical Levels: Supports and Resistances
USDJPY currently trading at 141.85 at the time of writing. Pair opened at 141.86 and is trading with a change of -0.01 % .
| Overview | Overview.1 | |
|---|---|---|
| 0 | Today last price | 141.85 |
| 1 | Today Daily Change | -0.01 |
| 2 | Today Daily Change % | -0.01 |
| 3 | Today daily open | 141.86 |
The pair remains strongly bullish on the daily timeframe. It trades above its 20 SMA @ 139.77, 50 SMA 136.91, 100 SMA @ 135.01 and 200 SMA @ 137.24.
| Trends | Trends.1 | |
|---|---|---|
| 0 | Daily SMA20 | 139.77 |
| 1 | Daily SMA50 | 136.91 |
| 2 | Daily SMA100 | 135.01 |
| 3 | Daily SMA200 | 137.24 |
The previous day high was 141.92 while the previous day low was 139.85. The daily 38.2% Fib levels comes at 141.13, expected to provide support. Similarly, the daily 61.8% fib level is at 140.64, expected to provide support.
Note the levels of interest below:
- Pivot support is noted at 140.51, 139.15, 138.44
- Pivot resistance is noted at 142.57, 143.27, 144.63
| Levels | Levels.1 |
|---|---|
| Previous Daily High | 141.92 |
| Previous Daily Low | 139.85 |
| Previous Weekly High | 141.92 |
| Previous Weekly Low | 139.01 |
| Previous Monthly High | 140.93 |
| Previous Monthly Low | 133.50 |
| Daily Fibonacci 38.2% | 141.13 |
| Daily Fibonacci 61.8% | 140.64 |
| Daily Pivot Point S1 | 140.51 |
| Daily Pivot Point S2 | 139.15 |
| Daily Pivot Point S3 | 138.44 |
| Daily Pivot Point R1 | 142.57 |
| Daily Pivot Point R2 | 143.27 |
| Daily Pivot Point R3 | 144.63 |
[/s2If]
Nehcap Expert Advisor
The NEHCAP MT4 EA is high quality professional trading system geared to generate returns without using GRID or martingales. Each trade has strict risk per trade parameter. The pairs under management include EURUSD, GBPUSD, AUDCAD, AUDNZD,GBPAUD, EURAUD, EURCAD, CHFJPY and many more.
The system is trading live: LIVE ACCOUNT TRACKING
You can run it free. Apply for a free trial and track our account. Buy the system or use profit share mechanism to generate returns on your MT4.
Join Our Telegram Group
")


