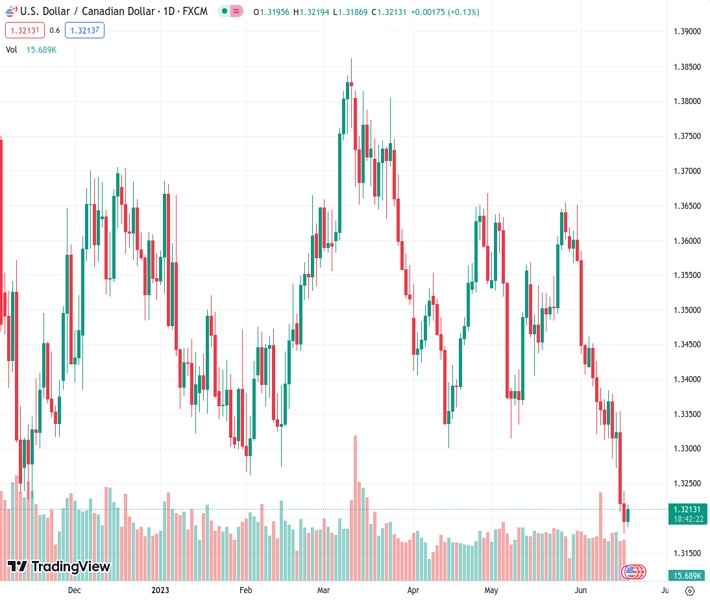
During a slow trading session inspired by the Juneteenth holiday, USDCAD has rebounded from its yearly low and reached a new intraday high at 1.32122.
…
This is a premium post.
[s2If !current_user_can(access_s2member_level4)]Please register for FREE REGISTER to read full post below containing analysis. In case of any error or you think you are not able to read the full post below, please email us at support#nehcap.com [lwa][/s2If] [s2If current_user_can(access_s2member_level1)]
- USD/CAD renews intraday high as it recovers from yearly low during Juneteenth holiday-inspired sluggish trading.
The pair currently trades last at 1.32122.
The previous day high was 1.3239 while the previous day low was 1.3178. The daily 38.2% Fib levels comes at 1.3201, expected to provide support. Similarly, the daily 61.8% fib level is at 1.3216, expected to provide resistance.
USD/CAD picks up bids to consolidate the recent losses around the yearly low, refreshing the intraday top near 1.3215 amid early Monday. In doing so, the Loonie pair snaps a two-day downtrend while justifying the broad US Dollar recovery, as well as the downbeat prices of Canada’s main export item WTI crude oil, during a sluggish session due to the Juneteenth holiday in the US.
US Dollar Index (DXY) extends the previous day’s corrective bounce off the monthly low amid slightly downbeat sentiment and the hawkish Fed signals, while also ignoring the mixed US data flashed the previous day. With this, the greenback’s gauge versus the six major currency pair sticks to minor gains around 102.35. On the other hand, WTI crude oil sellers attack the $71.00 round figure while printing the first daily loss in seven.
Headlines surrounding multiple banks cutting China’s growth forecasts and fears of heavy Oil inflow from Iran, due to the likely US-Iran deal, appear to weigh on the WTI crude oil prices. The same joins Fed policymakers’ defense of the July rate hike concerns to weigh on the sentiment and the black gold, as well as favor the DXY.
Preliminary readings of the University of Michigan (UoM) Consumer Sentiment Index (CSI) for June improved but the US inflation expectations eased and tamed the US Dollar bulls. Even so, Fed policymakers have been hawkish of late and allowed the DXY to consolidate recent losses amid a sluggish start to another key week. It’s worth noting that the US Dollar Index dropped the most since early January in the last week. However, downbeat US inflation, Retail Sales and Fed’s hawkish pause join the news about the US-China ties to prod the USD/CAD bulls.
It’s worth noting that the S&P500 Futures print mild losses while tracing Wall Street benchmarks whereas the yields remain lackluster, grinding higher of late.
Moving on, an absence of the US traders will restrict the USD/CAD pair’s moves on Monday. However, Fed Chairman Powell’s bi-annual testimony, as well as PMIs for June, will also be important to watch for clear directions. Also important to watch are the latest outcomes of Canadian Industrial Production and Retail Sales.
Despite the latest corrective bounce, mainly due to the oversold RSI (14) conditions, the USD/CAD remains on the seller’s radar unless crossing the previous support line stretched from November 2022, around 1.3330 by the press time.
Technical Levels: Supports and Resistances
USDCAD currently trading at 1.3213 at the time of writing. Pair opened at 1.3198 and is trading with a change of 0.11% % .
| Overview | Overview.1 | |
|---|---|---|
| 0 | Today last price | 1.3213 |
| 1 | Today Daily Change | 0.0015 |
| 2 | Today Daily Change % | 0.11% |
| 3 | Today daily open | 1.3198 |
The pair remains strongly bearish on the daily time frame. It trades below the 20 SMA @ 1.3443, 50 SMA 1.3469, 100 SMA @ 1.3512 and 200 SMA @ 1.3518.
| Trends | Trends.1 | |
|---|---|---|
| 0 | Daily SMA20 | 1.3443 |
| 1 | Daily SMA50 | 1.3469 |
| 2 | Daily SMA100 | 1.3512 |
| 3 | Daily SMA200 | 1.3518 |
The previous day high was 1.3239 while the previous day low was 1.3178. The daily 38.2% Fib levels comes at 1.3201, expected to provide support. Similarly, the daily 61.8% fib level is at 1.3216, expected to provide resistance.
Note the levels of interest below:
- Pivot support is noted at 1.3171, 1.3143, 1.3109
- Pivot resistance is noted at 1.3232, 1.3267, 1.3294
| Levels | Levels.1 |
|---|---|
| Previous Daily High | 1.3239 |
| Previous Daily Low | 1.3178 |
| Previous Weekly High | 1.3384 |
| Previous Weekly Low | 1.3178 |
| Previous Monthly High | 1.3655 |
| Previous Monthly Low | 1.3315 |
| Daily Fibonacci 38.2% | 1.3201 |
| Daily Fibonacci 61.8% | 1.3216 |
| Daily Pivot Point S1 | 1.3171 |
| Daily Pivot Point S2 | 1.3143 |
| Daily Pivot Point S3 | 1.3109 |
| Daily Pivot Point R1 | 1.3232 |
| Daily Pivot Point R2 | 1.3267 |
| Daily Pivot Point R3 | 1.3294 |
[/s2If]
Nehcap Expert Advisor
The NEHCAP MT4 EA is high quality professional trading system geared to generate returns without using GRID or martingales. Each trade has strict risk per trade parameter. The pairs under management include EURUSD, GBPUSD, AUDCAD, AUDNZD,GBPAUD, EURAUD, EURCAD, CHFJPY and many more.
The system is trading live: LIVE ACCOUNT TRACKING
You can run it free. Apply for a free trial and track our account. Buy the system or use profit share mechanism to generate returns on your MT4.
Join Our Telegram Group
")


