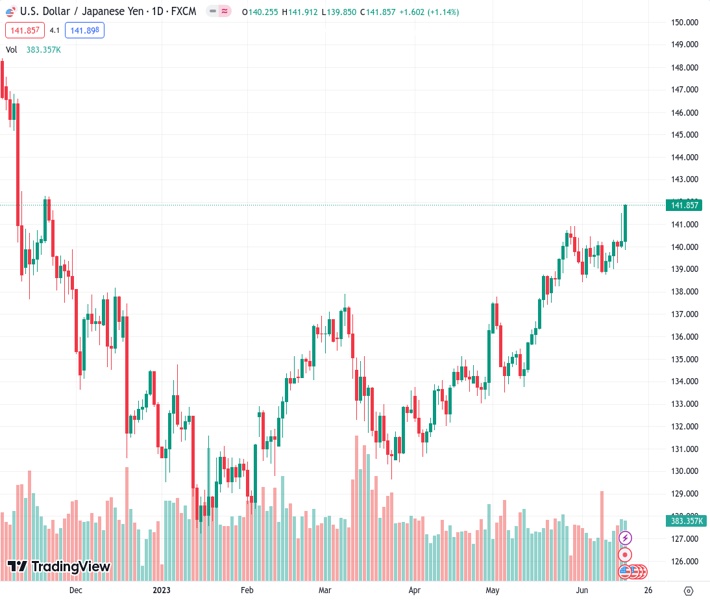
The USDJPY currency pair increased sharply to reach its highest level of the year at 141.91, but if it fails to exceed 142.00, it could trigger a decline in value leading to selling of the currency.
…
This is a premium post.
[s2If !current_user_can(access_s2member_level4)]Please register for FREE REGISTER to read full post below containing analysis. In case of any error or you think you are not able to read the full post below, please email us at support#nehcap.com [lwa][/s2If] [s2If current_user_can(access_s2member_level1)]
- USD/JPY surges to a YTD high of 141.91, though failure to surpass 142.00 could trigger a sell-off.
The pair currently trades last at 141.820.
The previous day high was 141.5 while the previous day low was 139.94. The daily 38.2% Fib levels comes at 140.91, expected to provide support. Similarly, the daily 61.8% fib level is at 140.54, expected to provide support.
USD/JPY soared more than 1% on Friday due to safe-haven flows and a jump in US Treasury bond yields. On its way north, the USD/JPY reached a new year-to-date (YTD) high of 141.91 after bouncing off daily lows of 139.85. At the time of writing, the USD/JPY is exchanging hands at 141.85.
USD/JPY finished the week with a higher tone but facing solid resistance, as the daily chart shows. The major has been trading within a rising wedge, and the USD/JPY closed nearby the top-trendline of the pattern at around 141.86. Failure to crack resistance and push prices above 142.00 would expose the USD/JPY to selling pressure. In addition, Japanese authorities’ language interventions in the FX markets could weigh on the pair and open the door for a correction.
With the USD/JPY’s path of least resistance being upwards, the pair’s first ceiling level would be 142.00. Break above will expose the November 22 high at 142.24, ahead of reaching 143.00. Conversely, the USD/JPY could dive to May’s 29 high turned support at 140.92 before dropping to the 20-day Exponential Moving Average (EMA) at 139.40.
Technical Levels: Supports and Resistances
USDJPY currently trading at 141.86 at the time of writing. Pair opened at 140.35 and is trading with a change of 1.08 % .
| Overview | Overview.1 | |
|---|---|---|
| 0 | Today last price | 141.86 |
| 1 | Today Daily Change | 1.51 |
| 2 | Today Daily Change % | 1.08 |
| 3 | Today daily open | 140.35 |
The pair remains strongly bullish on the daily timeframe. It trades above its 20 SMA @ 139.58, 50 SMA 136.71, 100 SMA @ 134.89 and 200 SMA @ 137.24.
| Trends | Trends.1 | |
|---|---|---|
| 0 | Daily SMA20 | 139.58 |
| 1 | Daily SMA50 | 136.71 |
| 2 | Daily SMA100 | 134.89 |
| 3 | Daily SMA200 | 137.24 |
The previous day high was 141.5 while the previous day low was 139.94. The daily 38.2% Fib levels comes at 140.91, expected to provide support. Similarly, the daily 61.8% fib level is at 140.54, expected to provide support.
Note the levels of interest below:
- Pivot support is noted at 139.7, 139.04, 138.14
- Pivot resistance is noted at 141.26, 142.16, 142.82
| Levels | Levels.1 |
|---|---|
| Previous Daily High | 141.50 |
| Previous Daily Low | 139.94 |
| Previous Weekly High | 140.45 |
| Previous Weekly Low | 138.76 |
| Previous Monthly High | 140.93 |
| Previous Monthly Low | 133.50 |
| Daily Fibonacci 38.2% | 140.91 |
| Daily Fibonacci 61.8% | 140.54 |
| Daily Pivot Point S1 | 139.70 |
| Daily Pivot Point S2 | 139.04 |
| Daily Pivot Point S3 | 138.14 |
| Daily Pivot Point R1 | 141.26 |
| Daily Pivot Point R2 | 142.16 |
| Daily Pivot Point R3 | 142.82 |
[/s2If]
Nehcap Expert Advisor
The NEHCAP MT4 EA is high quality professional trading system geared to generate returns without using GRID or martingales. Each trade has strict risk per trade parameter. The pairs under management include EURUSD, GBPUSD, AUDCAD, AUDNZD,GBPAUD, EURAUD, EURCAD, CHFJPY and many more.
The system is trading live: LIVE ACCOUNT TRACKING
You can run it free. Apply for a free trial and track our account. Buy the system or use profit share mechanism to generate returns on your MT4.
Join Our Telegram Group
")


