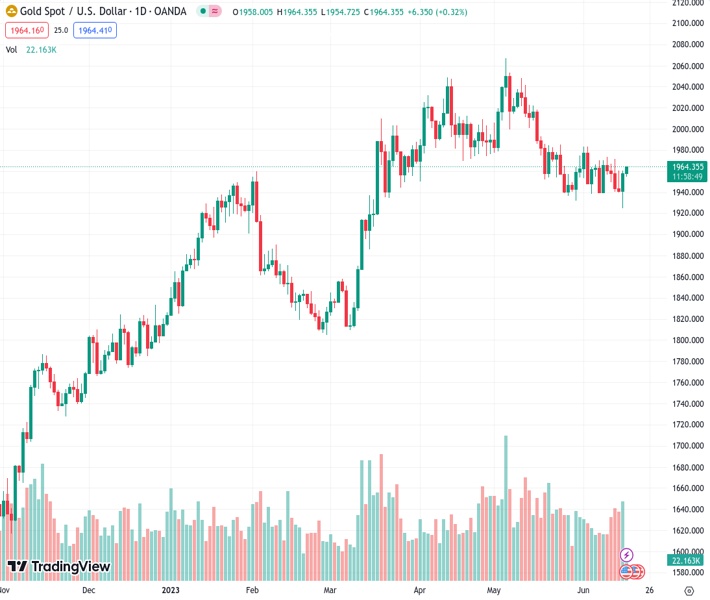
The price of gold, represented by #XAUUSD at 1,963.39, has increased in value for two consecutive days but does not seem to have strong bullish momentum.
…
This is a premium post.
[s2If !current_user_can(access_s2member_level4)]Please register for FREE REGISTER to read full post below containing analysis. In case of any error or you think you are not able to read the full post below, please email us at support#nehcap.com [lwa][/s2If] [s2If current_user_can(access_s2member_level1)]
- Gold price gains positive traction for the second straight day, though lacks bullish conviction.
The pair currently trades last at 1963.39.
The previous day high was 1960.31 while the previous day low was 1924.85. The daily 38.2% Fib levels comes at 1946.76, expected to provide support. Similarly, the daily 61.8% fib level is at 1938.4, expected to provide support.
Gold price builds on the overnight goodish recovery from the $1,925-$1,924 area, or a nearly three-month low and attracts some follow-through buying for the second successive day on Friday. The XAU/USD trades with a mild positive bias through the early part of the European session and is currently placed just above the $1,960 level, up over 0.20% for the day.
The uncertainty over the Federal Reserve’s (Fed) rate-hike path is seen as a key factor lending some support to the non-yielding Gold price, though any meaningful appreciating move still seems elusive. Thursday’s rather unimpressive macro data from the United States (US) raised questions over how much headroom the Fed has to keep raising rates and fueled speculations that the end of the current policy tightening cycle is nearing.
The Fed, however, has signalled earlier this week that borrowing costs may still need to rise by as much as 50 bps by the end of this year. This, along with a modest uptick in the US Treasury bond yields, assists the US Dollar (USD) to stage a modest recovery from over a one-month low touched earlier this Friday. A modest USD strength might hold back traders from placing bullish bets around the US Dollar-denominated Gold price.
Furthermore, a more hawkish outlook by other major central banks might further contribute to capping the upside for the yellow metal. It is worth recalling that the Reserve Bank of Australia (RBA) and the Bank of Canada (BoC) delivered a surprise 25 basis point (bps) rate hike last week. The European Central Bank (ECB) also lifted rates by 25 bps, to the highest level in 22 years, and indicated further tightening to bring down inflation.
Moreover, the Bank of England (BoE) is expected to be far more aggressive in policy tightening to contain stubbornly high inflation and hike interest rates by 25 bps on June 22. Apart from this, a generally positive tone around the equity markets makes it prudent to wait for strong follow-through buying before confirming that the Gold price has formed a near-term bottom and positioning for any further gains.
Technical Levels: Supports and Resistances
XAUUSD currently trading at 1962.49 at the time of writing. Pair opened at 1958.12 and is trading with a change of 0.22 % .
| Overview | Overview.1 | |
|---|---|---|
| 0 | Today last price | 1962.49 |
| 1 | Today Daily Change | 4.37 |
| 2 | Today Daily Change % | 0.22 |
| 3 | Today daily open | 1958.12 |
The pair is trading above its 20 Daily moving average @ 1957.79, below its 50 Daily moving average @ 1986.32 , above its 100 Daily moving average @ 1941.79 and above its 200 Daily moving average @ 1846.39
| Trends | Trends.1 | |
|---|---|---|
| 0 | Daily SMA20 | 1957.79 |
| 1 | Daily SMA50 | 1986.32 |
| 2 | Daily SMA100 | 1941.79 |
| 3 | Daily SMA200 | 1846.39 |
The previous day high was 1960.31 while the previous day low was 1924.85. The daily 38.2% Fib levels comes at 1946.76, expected to provide support. Similarly, the daily 61.8% fib level is at 1938.4, expected to provide support.
Note the levels of interest below:
- Pivot support is noted at 1935.21, 1912.3, 1899.75
- Pivot resistance is noted at 1970.67, 1983.22, 2006.13
| Levels | Levels.1 |
|---|---|
| Previous Daily High | 1960.31 |
| Previous Daily Low | 1924.85 |
| Previous Weekly High | 1973.15 |
| Previous Weekly Low | 1938.15 |
| Previous Monthly High | 2079.76 |
| Previous Monthly Low | 1932.12 |
| Daily Fibonacci 38.2% | 1946.76 |
| Daily Fibonacci 61.8% | 1938.40 |
| Daily Pivot Point S1 | 1935.21 |
| Daily Pivot Point S2 | 1912.30 |
| Daily Pivot Point S3 | 1899.75 |
| Daily Pivot Point R1 | 1970.67 |
| Daily Pivot Point R2 | 1983.22 |
| Daily Pivot Point R3 | 2006.13 |
[/s2If]
Nehcap Expert Advisor
The NEHCAP MT4 EA is high quality professional trading system geared to generate returns without using GRID or martingales. Each trade has strict risk per trade parameter. The pairs under management include EURUSD, GBPUSD, AUDCAD, AUDNZD,GBPAUD, EURAUD, EURCAD, CHFJPY and many more.
The system is trading live: LIVE ACCOUNT TRACKING
You can run it free. Apply for a free trial and track our account. Buy the system or use profit share mechanism to generate returns on your MT4.
Join Our Telegram Group
")


