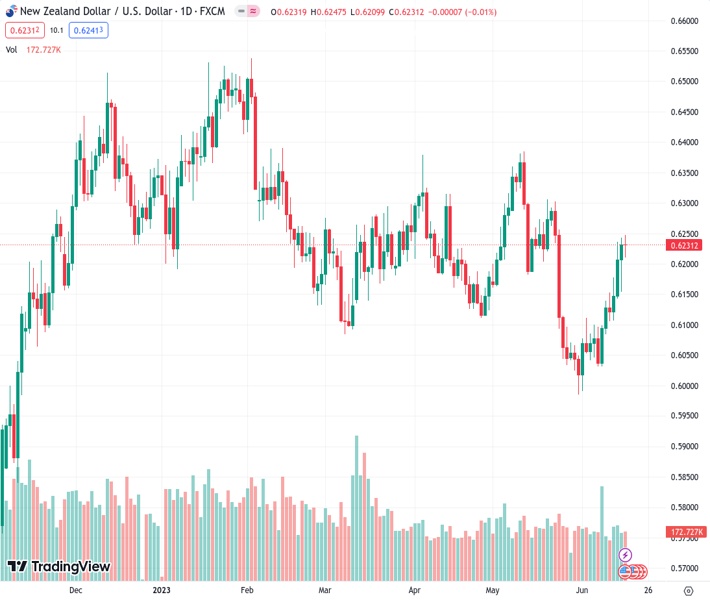
On Friday, NZDUSD remained stable at the level of 0.6230, however, it achieved an increase of 1.70% for the week.
…
This is a premium post.
[s2If !current_user_can(access_s2member_level4)]Please register for FREE REGISTER to read full post below containing analysis. In case of any error or you think you are not able to read the full post below, please email us at support#nehcap.com [lwa][/s2If] [s2If current_user_can(access_s2member_level1)]
- NZD/USD traded neutral at the 0.6230 area on Friday but set a 1.70% weekly gain.,
The pair currently trades last at 0.62330.
The previous day high was 0.6244 while the previous day low was 0.6076. The daily 38.2% Fib levels comes at 0.618, expected to provide support. Similarly, the daily 61.8% fib level is at 0.614, expected to provide support.
The NZD/USD traded stable at the 0.6210 – 0.6245 range at the end of the week, holding to a 170 pip weekly gain. In that sense, hawkish Federal Reserve (Fed) speakers lifted the US bond yields while upbeat consumer confidence data from the University of Michigan gave the Greenback an additional boost. On the NZD’s side, now relevant economic data was released, and the Kiwi’s gains seem to be capped by the confirmation of New Zealand’s economy entering a recession following Gross Domestic Product (GDP) on Wednesday.
On Wednesday, Fed Chair Powell stated that a rate-hike pause was needed in order to assess additional information and its implications on monetary policy, while the dot plots showed that members foresee an additional 50 basis points tightening for the rest of 2023. In that sense, as stocks rallied through Thursday, investors seemed not to believe the Fed, so speakers were today on the wires supporting the hawkish case.
That being said, Fed’s Christopher Waller expressed his concerns regarding the limited advancement in core inflation and indicated the potential need for additional hikes. Later, Fed Thomas Barkin stated that he is open to taking further action if the data justifies it. As a reaction, shorter-term bond yields rose across the board on Friday. The 10-year bond yield rose to 3.76%, while the 2-year yield increased to 4.73% and the 5-year to 4.00%, respectively, with the 2-year rate leading the way showing a 2% increase and giving support to the USD.
In addition, the University of Michigan (UoM) released its Consumer Sentiment Index for June, which exceeded predictions, reaching 63.9. This indicates a rise in consumer confidence compared to the previous reading of 59.2. Furthermore, the five-year Consumer Inflation Expectation declined from the expected 3.1% to 3%, with these encouraging figures also contributing to the Greenback holding its ground.
Both the weekly and daily chart suggest a bullish outlook for the NZD. On the weekly chart, the pair consolidates a third-consecutive advance.Out of the last seven days, the Kiwi tallied gains in six of them. In addition, both the Relative Strength Index (RSI) and Moving Average Convergence Divergence (MACD) suggest that the buyers have the upperhand.
In case of correcting to the downside, immediate support is seen at the 100-day Simple Moving Average (SMA) at 0.6218 followed by the 0.6200 psychological mark and the 200-day SMA at 0.6150. On the other hand, resistances line up at 0.6250 followed by 0.6300 (May 12 high) and the 0.62320 area.
Technical Levels: Supports and Resistances
NZDUSD currently trading at 0.6211 at the time of writing. Pair opened at 0.6242 and is trading with a change of -0.5 % .
| Overview | Overview.1 | |
|---|---|---|
| 0 | Today last price | 0.6211 |
| 1 | Today Daily Change | -0.0031 |
| 2 | Today Daily Change % | -0.5000 |
| 3 | Today daily open | 0.6242 |
The pair is trading above its 20 Daily moving average @ 0.6114, above its 50 Daily moving average @ 0.6179 , below its 100 Daily moving average @ 0.6221 and above its 200 Daily moving average @ 0.6151
| Trends | Trends.1 | |
|---|---|---|
| 0 | Daily SMA20 | 0.6114 |
| 1 | Daily SMA50 | 0.6179 |
| 2 | Daily SMA100 | 0.6221 |
| 3 | Daily SMA200 | 0.6151 |
The previous day high was 0.6244 while the previous day low was 0.6076. The daily 38.2% Fib levels comes at 0.618, expected to provide support. Similarly, the daily 61.8% fib level is at 0.614, expected to provide support.
Note the levels of interest below:
- Pivot support is noted at 0.6131, 0.6019, 0.5963
- Pivot resistance is noted at 0.6299, 0.6355, 0.6467
| Levels | Levels.1 |
|---|---|
| Previous Daily High | 0.6244 |
| Previous Daily Low | 0.6076 |
| Previous Weekly High | 0.6143 |
| Previous Weekly Low | 0.6026 |
| Previous Monthly High | 0.6385 |
| Previous Monthly Low | 0.5985 |
| Daily Fibonacci 38.2% | 0.6180 |
| Daily Fibonacci 61.8% | 0.6140 |
| Daily Pivot Point S1 | 0.6131 |
| Daily Pivot Point S2 | 0.6019 |
| Daily Pivot Point S3 | 0.5963 |
| Daily Pivot Point R1 | 0.6299 |
| Daily Pivot Point R2 | 0.6355 |
| Daily Pivot Point R3 | 0.6467 |
[/s2If]
Nehcap Expert Advisor
The NEHCAP MT4 EA is high quality professional trading system geared to generate returns without using GRID or martingales. Each trade has strict risk per trade parameter. The pairs under management include EURUSD, GBPUSD, AUDCAD, AUDNZD,GBPAUD, EURAUD, EURCAD, CHFJPY and many more.
The system is trading live: LIVE ACCOUNT TRACKING
You can run it free. Apply for a free trial and track our account. Buy the system or use profit share mechanism to generate returns on your MT4.
Join Our Telegram Group
")


