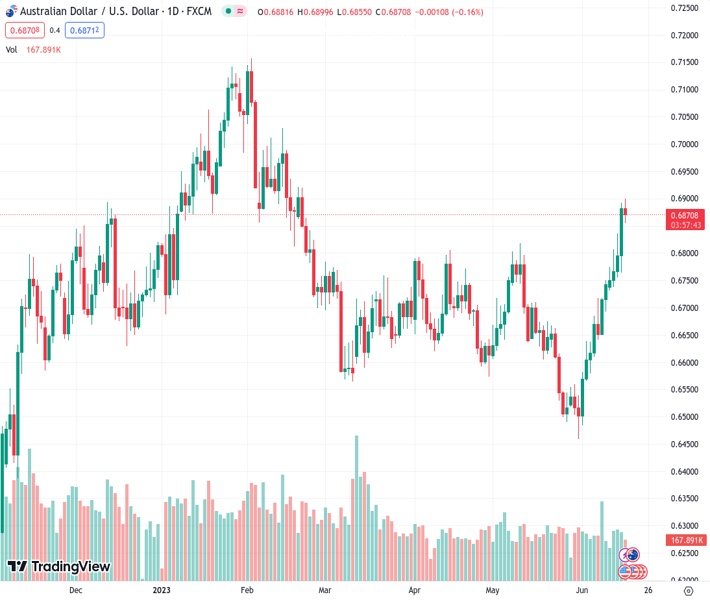
Although experiencing a decline, #AUDUSD at 0.68694 appears poised to end its third straight week with a positive gain.
…
This is a premium post.
[s2If !current_user_can(access_s2member_level4)]Please register for FREE REGISTER to read full post below containing analysis. In case of any error or you think you are not able to read the full post below, please email us at support#nehcap.com [lwa][/s2If] [s2If current_user_can(access_s2member_level1)]
- AUD/USD corrects lower but is set to close a third consecutive weekly gain.
The pair currently trades last at 0.68694.
The previous day high was 0.6893 while the previous day low was 0.6767. The daily 38.2% Fib levels comes at 0.6845, expected to provide support. Similarly, the daily 61.8% fib level is at 0.6815, expected to provide support.
At the end of the week, the AUD/USD bulls seem to have taken a step back, after six consecutive days of gains and the pair retreated to the 0.6860 area. In that sense, the USD managed to hold its ground amid upbeat Michigan Consumer Sentiment Index and hawkish Fed speakers. On the Australian front, eyes are on next week’s Reserve Bank of Australia (RBA) minutes.
The University of Michigan (UoM) reported on Friday that the Michigan Consumer Sentiment Index came in at 63.9 in June vs 60 expected and accelerated from its previous figure of 59.2. In addition, the five-year Consumer Inflation Expectation from June dropped to 3% vs the consensus of 3.1%. The data helped the US Dollar find its feet after the recent decline.
In addition, Christopher Waller from the Federal Reserve (Fed) stated that he is concerned with core inflation not seeing progress adding that it may require more tightening. Elsewhere, Thomas Barkin mentioned that he is comfortable “doing more” if the data warrants it. It’s worth noting that on Wednesday, the revised dot plots from the Federal Open Market Committee (FOMC) showed that members are seeing two more 25 bps hikes this year, so the hawkish stance from the Fed gives the USD traction.
On the other hand, the focus now shifts to Tuesday’s RBA minutes where investors will look for clues as to why Governor Philip Lowe decided to unexpectedly hike rates by 25 basis points to 4.10% in the last monetary policy meeting.
According to the daily chart, the AUD/USD holds a neutral to the bullish outlook for the short term as the bulls seemed to have taken a step back to consolidate gains, but indicators still favor the Aussie. However, as the pair remains in overbought conditions, more downside may be on the horizon.
If AUD/USD manages to move higher, the next resistances to watch are at the daily high at 0.6890, followed by the psychological mark at 0.6900 and the 0.6920 area. On the other hand, immediate support for the pair line up at 0.6800, 0.6730 and 0.6690.
Technical Levels: Supports and Resistances
AUDUSD currently trading at 0.6863 at the time of writing. Pair opened at 0.6885 and is trading with a change of -0.32 % .
| Overview | Overview.1 | |
|---|---|---|
| 0 | Today last price | 0.6863 |
| 1 | Today Daily Change | -0.0022 |
| 2 | Today Daily Change % | -0.3200 |
| 3 | Today daily open | 0.6885 |
The pair remains strongly bullish on the daily timeframe. It trades above its 20 SMA @ 0.6641, 50 SMA 0.6668, 100 SMA @ 0.673 and 200 SMA @ 0.6692.
| Trends | Trends.1 | |
|---|---|---|
| 0 | Daily SMA20 | 0.6641 |
| 1 | Daily SMA50 | 0.6668 |
| 2 | Daily SMA100 | 0.6730 |
| 3 | Daily SMA200 | 0.6692 |
The previous day high was 0.6893 while the previous day low was 0.6767. The daily 38.2% Fib levels comes at 0.6845, expected to provide support. Similarly, the daily 61.8% fib level is at 0.6815, expected to provide support.
Note the levels of interest below:
- Pivot support is noted at 0.6804, 0.6722, 0.6678
- Pivot resistance is noted at 0.6929, 0.6974, 0.7055
| Levels | Levels.1 |
|---|---|
| Previous Daily High | 0.6893 |
| Previous Daily Low | 0.6767 |
| Previous Weekly High | 0.6751 |
| Previous Weekly Low | 0.6579 |
| Previous Monthly High | 0.6818 |
| Previous Monthly Low | 0.6458 |
| Daily Fibonacci 38.2% | 0.6845 |
| Daily Fibonacci 61.8% | 0.6815 |
| Daily Pivot Point S1 | 0.6804 |
| Daily Pivot Point S2 | 0.6722 |
| Daily Pivot Point S3 | 0.6678 |
| Daily Pivot Point R1 | 0.6929 |
| Daily Pivot Point R2 | 0.6974 |
| Daily Pivot Point R3 | 0.7055 |
[/s2If]
Nehcap Expert Advisor
The NEHCAP MT4 EA is high quality professional trading system geared to generate returns without using GRID or martingales. Each trade has strict risk per trade parameter. The pairs under management include EURUSD, GBPUSD, AUDCAD, AUDNZD,GBPAUD, EURAUD, EURCAD, CHFJPY and many more.
The system is trading live: LIVE ACCOUNT TRACKING
You can run it free. Apply for a free trial and track our account. Buy the system or use profit share mechanism to generate returns on your MT4.
Join Our Telegram Group
")


