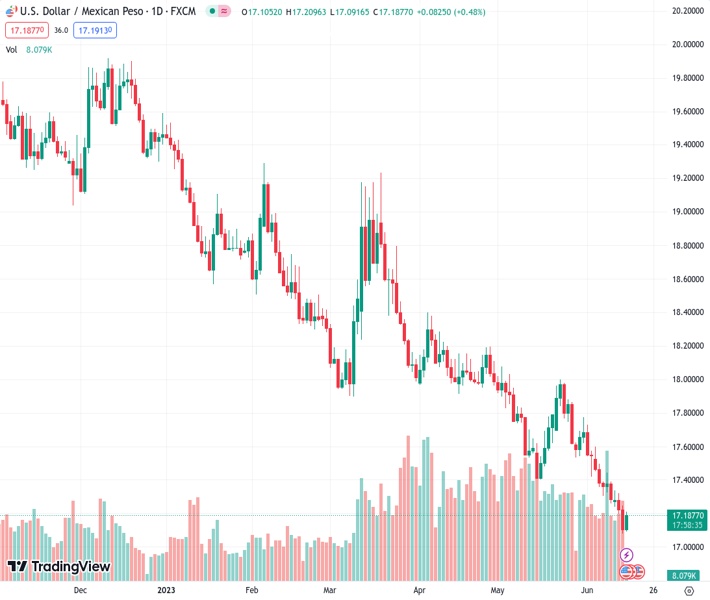
The USDMXN exchange rate has recorded its first daily increase in three, recovering from its lowest level since 2016. However, according to the viewpoint of @nehcap, a decline is anticipated.
…
This is a premium post.
[s2If !current_user_can(access_s2member_level4)]Please register for FREE REGISTER to read full post below containing analysis. In case of any error or you think you are not able to read the full post below, please email us at support#nehcap.com [lwa][/s2If] [s2If current_user_can(access_s2member_level1)]
- USD/MXN prints the first daily gains in three, bounces off the lowest levels since 2016.
The pair currently trades last at 17.1894.
The previous day high was 17.2471 while the previous day low was 17.0789. The daily 38.2% Fib levels comes at 17.1431, expected to provide support. Similarly, the daily 61.8% fib level is at 17.1829, expected to provide support.
USD/MXN grinds near intraday high of around 17.20 as it prod the 50-Hour Moving Average (HMA) during the first positive day in three on early Thursday. In doing so, the Mexican Peso (MXN) pair defends the late Wednesday’s rebound from the lowest levels since 2016.
That said, a clear break of the previous resistance line stretched from Tuesday joins bullish MACD signals and upbeat RSI (14) line, not overbought, to keep the USD/MXN bulls hopeful.
However, multiple hurdles toward the north keep challenging the pair’s upside momentum.
Among them, the 50-HMA level of around 17.21 guards immediate recovery ahead of a one-week-old downward-sloping resistance line, around 17.25 by the press time.
Following that, the 100-HMA and the 200-HMA, respectively near 17.26 and 17.35 in that order, will challenge the USD/MXN bulls before giving control to them.
On the flip side, a clear break of the resistance-turned-support line, near 17.16 by the press time, becomes necessary to convince USD/MXN sellers.
Following that, the bears may easily conquer the latest trough of 17.07 in search of poking the 17.00 psychological magnet.
It should be noted that the year 2016 bottom of around 17.05 acts as an extra filter toward the south.
Trend: Pullback expected
Technical Levels: Supports and Resistances
USDMXN currently trading at 17.2092 at the time of writing. Pair opened at 17.1068 and is trading with a change of 0.60% % .
| Overview | Overview.1 | |
|---|---|---|
| 0 | Today last price | 17.2092 |
| 1 | Today Daily Change | 0.1024 |
| 2 | Today Daily Change % | 0.60% |
| 3 | Today daily open | 17.1068 |
The pair remains strongly bearish on the daily time frame. It trades below the 20 SMA @ 17.5604, 50 SMA 17.7747, 100 SMA @ 18.1337 and 200 SMA @ 18.8751.
| Trends | Trends.1 | |
|---|---|---|
| 0 | Daily SMA20 | 17.5604 |
| 1 | Daily SMA50 | 17.7747 |
| 2 | Daily SMA100 | 18.1337 |
| 3 | Daily SMA200 | 18.8751 |
The previous day high was 17.2471 while the previous day low was 17.0789. The daily 38.2% Fib levels comes at 17.1431, expected to provide support. Similarly, the daily 61.8% fib level is at 17.1829, expected to provide support.
Note the levels of interest below:
- Pivot support is noted at 17.0414, 16.976, 16.8731
- Pivot resistance is noted at 17.2097, 17.3125, 17.3779
| Levels | Levels.1 |
|---|---|
| Previous Daily High | 17.2471 |
| Previous Daily Low | 17.0789 |
| Previous Weekly High | 17.5981 |
| Previous Weekly Low | 17.2591 |
| Previous Monthly High | 18.0780 |
| Previous Monthly Low | 17.4203 |
| Daily Fibonacci 38.2% | 17.1431 |
| Daily Fibonacci 61.8% | 17.1829 |
| Daily Pivot Point S1 | 17.0414 |
| Daily Pivot Point S2 | 16.9760 |
| Daily Pivot Point S3 | 16.8731 |
| Daily Pivot Point R1 | 17.2097 |
| Daily Pivot Point R2 | 17.3125 |
| Daily Pivot Point R3 | 17.3779 |
[/s2If]
Nehcap Expert Advisor
The NEHCAP MT4 EA is high quality professional trading system geared to generate returns without using GRID or martingales. Each trade has strict risk per trade parameter. The pairs under management include EURUSD, GBPUSD, AUDCAD, AUDNZD,GBPAUD, EURAUD, EURCAD, CHFJPY and many more.
The system is trading live: LIVE ACCOUNT TRACKING
You can run it free. Apply for a free trial and track our account. Buy the system or use profit share mechanism to generate returns on your MT4.
Join Our Telegram Group
")


