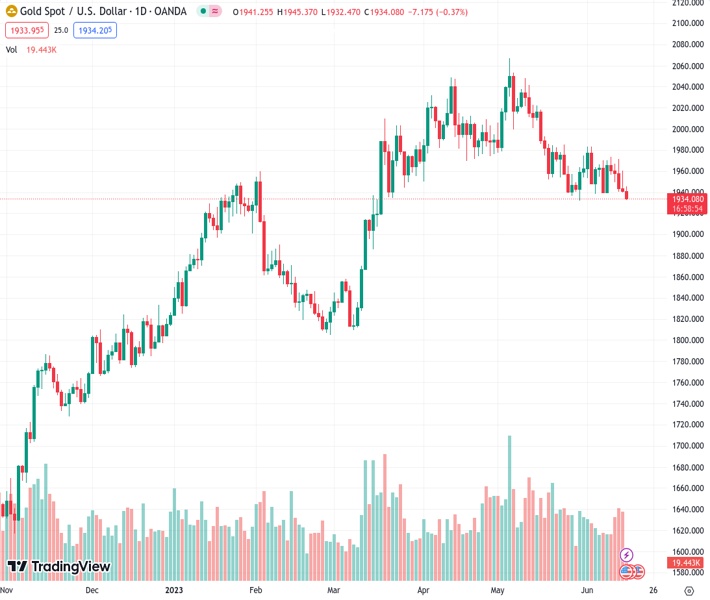
The price of gold, represented by XAUUSD at 1,934.52, has been decreasing steadily for the past five days and is approaching the lowest point it reached in May.
…
This is a premium post.
[s2If !current_user_can(access_s2member_level4)]Please register for FREE REGISTER to read full post below containing analysis. In case of any error or you think you are not able to read the full post below, please email us at support#nehcap.com [lwa][/s2If] [s2If current_user_can(access_s2member_level1)]
- Gold price drifts lower for the fifth successive day and drops closer to the May monthly swing low.
The pair currently trades last at 1934.52.
The previous day high was 1960.33 while the previous day low was 1939.75. The daily 38.2% Fib levels comes at 1947.61, expected to provide resistance. Similarly, the daily 61.8% fib level is at 1952.47, expected to provide resistance.
Gold price remains under some selling pressure for the fifth straight day on Thursday and drops back closer to the May swing low during the Asian session. The XAU/USD currently trades around the $1,935 region and for now, seems to have found acceptance below the 100-day Simple Moving Average (SMA) pivotal support defended since the beginning of this month.
The prospects for further policy tightening by the Federal Reserve (Fed) keep traders wary of the non-yielding Gold price and contribute to an extension of the recent fall witnessed over the past week or so. It is worth recalling that the Fed, as was widely expected, held interest rates steady at the end of a two-day policy meeting on Wednesday, though showed the intent to resume its rate-hiking cycle. In fact, the so-called “dot plot” indicated that officials see rates peaking at 5.6% this year, higher than March’s projection of 5.1%, suggesting two more 25 basis points (bps) rate hikes this year.
The Fed also sees slightly stronger economic growth and forecasts the economy to grow by 1% this year — up from the 0.4% rise projected in May — before rising 1.1% in 2024 and 1.8% in 2025. In the post-meeting press conference, Fed Chair Jerome Powell said that the pause was out of caution, to gather more information before determining if rates need to rise again. Powell further described US growth and the job market as holding up better than expected. This, along with rising bets for more rate hikes by the European Central Bank (ECB) and the Bank of England (BoE), weighs on the Gold price.
The Fed’s hawkish outlook, meanwhile, leads to a modest uptick in the US Treasury bond yields and assists the US Dollar (USD) to regain positive traction. In fact, the USD Index (DXY), which tracks the Greenback against a basket of currencies, recovers further from a one-month low touched on Wednesday and turns out to be another factor driving flows away from the US Dollar-denominated Gold price. That said, a softer tone around the US equity futures lends some support to the safe-haven XAU/USD and might hold back bearish traders from placing aggressive bets, at least for the time being.
Investors remain worried about a global economic downturn and the fears were further fueled by the disappointing release of Chinese macro data on Thursday. The National Bureau of Statistics (NBS) reported that Retail Sales in China rose 12.7% YoY in May as compared to the 13.6% growth anticipated and 18.4% increase recorded in the previous month. Furthermore, China’s Industrial Production also fell short of market expectations and came in at 3.5% YoY, down from 5.6% prior. Meanwhile, the Fixed Asset Investment increased 4.0% YTD YoY in May vs 4.4% expected and 4.7% last.
Traders also seem reluctant and prefer to wait on the sidelines ahead of the highly-anticipated ECB monetary policy decision, which is expected to infuse some volatility in the markets. Traders on Thursday will further take cues from the US economic docket, featuring the release of monthly Retail Sales, the usual Weekly Initial Jobless Claims, Empire State Manufacturing Index, Philly Fed Manufacturing Index and Industrial Production. This, in turn, will influence the USD price dynamics later during the early North American session and provide some meaningful impetus to the Gold price.
From a technical perspective, some follow-through selling below the $1,930 level will reaffirm a near-term bearish breakdown and make the Gold price vulnerable to accelerate the fall towards the $1,900 round figure. The downward trajectory could get extended further and drag the XAU/USD towards the $1,876-$1,875 horizontal support en route to the very important 200-day SMA, currently around the $1,845 region.
On the flip side, the 100-day SMA support breakpoint, near the $1,941-$1,942 zone, now seems to act as an immediate hurdle. A sustained strength beyond might trigger a short-covering move and lift the Gold price to the $1,962-$1,964 resistance zone. This is followed by the $1,973-$1,975 supply zone and the $1,983-$1,985 barrier, above which the XAU/USD could aim to reclaim the $2,000 psychological mark and climb further to the next relevant resistance near the $2,010-$2,012 region.
Technical Levels: Supports and Resistances
XAUUSD currently trading at 1936.06 at the time of writing. Pair opened at 1942.49 and is trading with a change of -0.33 % .
| Overview | Overview.1 | |
|---|---|---|
| 0 | Today last price | 1936.06 |
| 1 | Today Daily Change | -6.43 |
| 2 | Today Daily Change % | -0.33 |
| 3 | Today daily open | 1942.49 |
The pair is trading below its 20 Daily moving average @ 1957.77, below its 50 Daily moving average @ 1987.58 , below its 100 Daily moving average @ 1941.68 and above its 200 Daily moving average @ 1845.19
| Trends | Trends.1 | |
|---|---|---|
| 0 | Daily SMA20 | 1957.77 |
| 1 | Daily SMA50 | 1987.58 |
| 2 | Daily SMA100 | 1941.68 |
| 3 | Daily SMA200 | 1845.19 |
The previous day high was 1960.33 while the previous day low was 1939.75. The daily 38.2% Fib levels comes at 1947.61, expected to provide resistance. Similarly, the daily 61.8% fib level is at 1952.47, expected to provide resistance.
Note the levels of interest below:
- Pivot support is noted at 1934.72, 1926.94, 1914.14
- Pivot resistance is noted at 1955.3, 1968.1, 1975.88
| Levels | Levels.1 |
|---|---|
| Previous Daily High | 1960.33 |
| Previous Daily Low | 1939.75 |
| Previous Weekly High | 1973.15 |
| Previous Weekly Low | 1938.15 |
| Previous Monthly High | 2079.76 |
| Previous Monthly Low | 1932.12 |
| Daily Fibonacci 38.2% | 1947.61 |
| Daily Fibonacci 61.8% | 1952.47 |
| Daily Pivot Point S1 | 1934.72 |
| Daily Pivot Point S2 | 1926.94 |
| Daily Pivot Point S3 | 1914.14 |
| Daily Pivot Point R1 | 1955.30 |
| Daily Pivot Point R2 | 1968.10 |
| Daily Pivot Point R3 | 1975.88 |
[/s2If]
Nehcap Expert Advisor
The NEHCAP MT4 EA is high quality professional trading system geared to generate returns without using GRID or martingales. Each trade has strict risk per trade parameter. The pairs under management include EURUSD, GBPUSD, AUDCAD, AUDNZD,GBPAUD, EURAUD, EURCAD, CHFJPY and many more.
The system is trading live: LIVE ACCOUNT TRACKING
You can run it free. Apply for a free trial and track our account. Buy the system or use profit share mechanism to generate returns on your MT4.
Join Our Telegram Group
")


