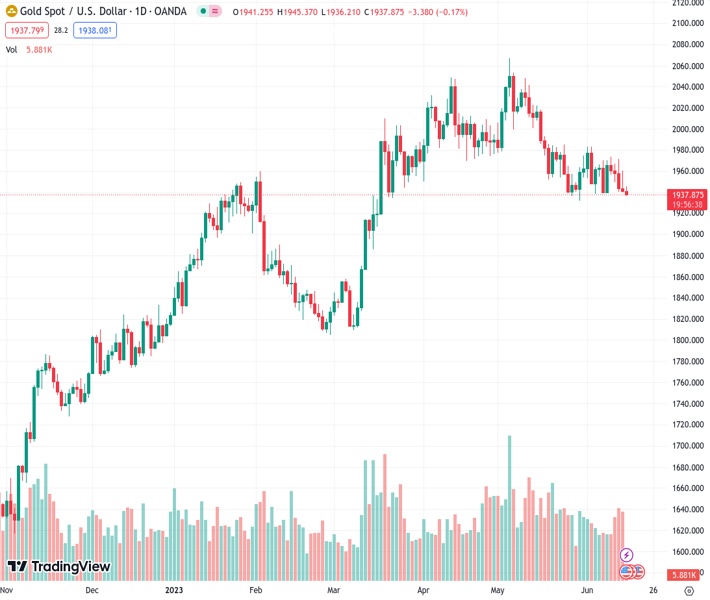
The price of gold, currently at 1,938.55 for the XAUUSD, is holding onto slight gains, but has ended a three-day period of decline. However, according to the analysis of @nehcap, it is predicted that there will be more negative movement to come.
…
This is a premium post.
[s2If !current_user_can(access_s2member_level4)]Please register for FREE REGISTER to read full post below containing analysis. In case of any error or you think you are not able to read the full post below, please email us at support#nehcap.com [lwa][/s2If] [s2If current_user_can(access_s2member_level1)]
- Gold Price clings to mild gains while snapping three-day downtrend.
The pair currently trades last at 1938.55.
The previous day high was 1960.33 while the previous day low was 1939.75. The daily 38.2% Fib levels comes at 1947.61, expected to provide resistance. Similarly, the daily 61.8% fib level is at 1952.47, expected to provide resistance.
Gold Price (XAU/USD) stays defensive around $1,945 as it prods the 100-DMA support after a three-day downtrend during the mid-Asian session on Thursday. That said, the United States (US) Federal Reserve (Fed) actions offered a volatile day and paused further downside of the XAU/USD but failed to push back the XAU/USD bears by offering a hawkish halt.
Gold Price marked a quick $14.00 fall after the United States (US) Federal Open Market Committee (FOMC) kept the benchmark Fed rate unchanged at 5.0-5.25%, matching market expectations of pausing the multi-month-old hawkish cycle that propelled rates for 10 consecutive times.
The reason for the XAU/USD fall could be linked to the upbeat FOMC Economic Projections and Federal Reserve (Fed) Chairman Jerome Powell’s speech. That said, the dot plot rose 30 bps from March for 2024 and 2025 to 4.6% and 3.4% respectively while the median rate forecasts suggest two more rate increases in 2023. Further, no rate cuts nor recession is expected in the current year whereas the median estimation for the US Gross Domestic Product (GDP) rose to 1.0% from 0.4% in March. Additionally, Powell’s speech unveils a “meeting by meeting” approach for decision-making but signals July as a ‘live’ meeting, suggesting a 0.25% rate hike.
Following the Fed showdown, the markets remained volatile on late Wednesday, as well as on early Thursday. As a result, Wall Street closed mixed whereas the US 10-year Treasury bond yield eased 1.0 basis point (bps) to 3.79% but its two-year counterpart grinds higher at the three-month top to 4.70%. That said, the US Dollar Index (DXY) dropped to the lowest level in a week before bouncing off $1,939.75.
While the Fed’s hawkish halt teases the Gold sellers, a softer print of the US Producer Price Index (PPI) for May, which dropped to 1.1% YoY versus 1.5% expected and 2.6% prior, seemed to have defended the downbeat inflation concerns and put a floor under the XAU/USD price.
It should also be noted that the Federal Reserve (Fed) has already highlighted importance of each incoming data for decision-making, which in turn emphasizes today’s United States Retail Sales for May and other mid-tier activity data, as well as the weekly Jobless Claims for the Gold Price watchers.
Elsewhere, fears of labor strikes in China, as per a Researcher at Hong Kong-based rights group China Labour Bulletin (CLB), joins recently downbeat statistics from Beijing to weigh on the Gold Price. It should be noted that China is among the world’s biggest Gold consumers and hence any negatives for the Dragon Nation appears negative for the XAU/USD.
With this in mind, China’s Retail Sales and Industrial Production for May will be more important to watch.
Gold Price remains depressed as it pokes the 100-DMA support of around $1,940 amid impending bearish signal from the Moving Average Convergence and Divergence (MACD) indicator.
However, the below 50.0 levels of the Relative Strength Index (RSI) line, placed at 14, joins the aforementioned 100-DMA surrounding $1,940 to prod the XAU/USD bears.
It should be noted that the Gold Price weakness past $1,940 opens a door a quick slump toward the 50% Fibonacci retracement level of the XAU/USD’s run-up from November 2022 to May 2023, near the $1,900 round figure.
Though, an ascending support line from late 2022, close to $1,895 by the press time, will challenge the Gold bears afterward.
On the contrary, XAU/USD recovery needs validation from the 21-DMA hurdle of around $1,958, a break of which can propel the Gold Price to the short-term key resistance, namely the 50-DMA resistance of near $1,987.
Also acting as an important challenge for the Gold buyers is the $2,000 round figure and March’s high of near $2,010.
Overall, Gold Price is likely to welcome sellers but the road towards the south appears long and bumpy.
Trend: Further downside expected
Technical Levels: Supports and Resistances
XAUUSD currently trading at 1945.34 at the time of writing. Pair opened at 1942.49 and is trading with a change of 0.15% % .
| Overview | Overview.1 | |
|---|---|---|
| 0 | Today last price | 1945.34 |
| 1 | Today Daily Change | 2.85 |
| 2 | Today Daily Change % | 0.15% |
| 3 | Today daily open | 1942.49 |
The pair is trading below its 20 Daily moving average @ 1957.77, below its 50 Daily moving average @ 1987.58 , above its 100 Daily moving average @ 1941.68 and above its 200 Daily moving average @ 1845.19
| Trends | Trends.1 | |
|---|---|---|
| 0 | Daily SMA20 | 1957.77 |
| 1 | Daily SMA50 | 1987.58 |
| 2 | Daily SMA100 | 1941.68 |
| 3 | Daily SMA200 | 1845.19 |
The previous day high was 1960.33 while the previous day low was 1939.75. The daily 38.2% Fib levels comes at 1947.61, expected to provide resistance. Similarly, the daily 61.8% fib level is at 1952.47, expected to provide resistance.
Note the levels of interest below:
- Pivot support is noted at 1934.72, 1926.94, 1914.14
- Pivot resistance is noted at 1955.3, 1968.1, 1975.88
| Levels | Levels.1 |
|---|---|
| Previous Daily High | 1960.33 |
| Previous Daily Low | 1939.75 |
| Previous Weekly High | 1973.15 |
| Previous Weekly Low | 1938.15 |
| Previous Monthly High | 2079.76 |
| Previous Monthly Low | 1932.12 |
| Daily Fibonacci 38.2% | 1947.61 |
| Daily Fibonacci 61.8% | 1952.47 |
| Daily Pivot Point S1 | 1934.72 |
| Daily Pivot Point S2 | 1926.94 |
| Daily Pivot Point S3 | 1914.14 |
| Daily Pivot Point R1 | 1955.30 |
| Daily Pivot Point R2 | 1968.10 |
| Daily Pivot Point R3 | 1975.88 |
[/s2If]
Nehcap Expert Advisor
The NEHCAP MT4 EA is high quality professional trading system geared to generate returns without using GRID or martingales. Each trade has strict risk per trade parameter. The pairs under management include EURUSD, GBPUSD, AUDCAD, AUDNZD,GBPAUD, EURAUD, EURCAD, CHFJPY and many more.
The system is trading live: LIVE ACCOUNT TRACKING
You can run it free. Apply for a free trial and track our account. Buy the system or use profit share mechanism to generate returns on your MT4.
Join Our Telegram Group
")


