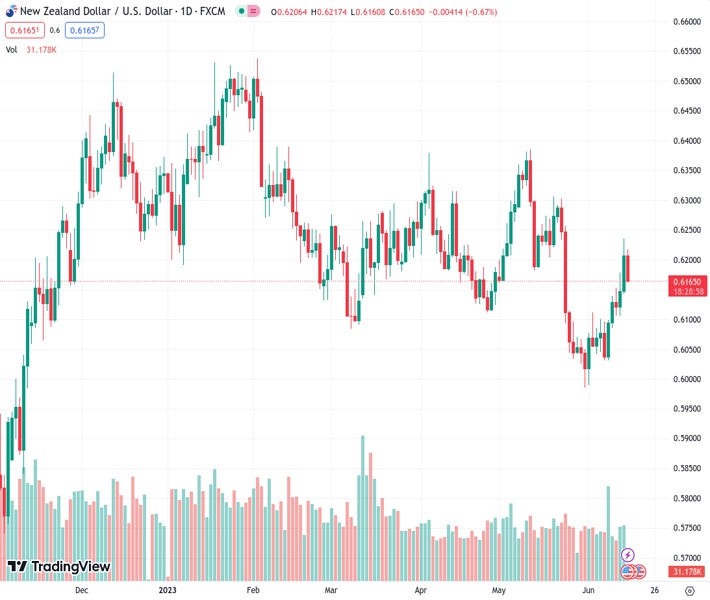
The NZD to USD exchange rate, currently at 0.61663, has moved away even more from its multi-week high due to various contributing factors.
…
This is a premium post.
[s2If !current_user_can(access_s2member_level4)]Please register for FREE REGISTER to read full post below containing analysis. In case of any error or you think you are not able to read the full post below, please email us at support#nehcap.com [lwa][/s2If] [s2If current_user_can(access_s2member_level1)]
- NZD/USD retreats further from a multi-week high and is pressured by a combination of factors.
The pair currently trades last at 0.61663.
The previous day high was 0.6236 while the previous day low was 0.6133. The daily 38.2% Fib levels comes at 0.6197, expected to provide resistance. Similarly, the daily 61.8% fib level is at 0.6173, expected to provide resistance.
The NZD/USD pair comes under heavy selling pressure during the Asian session on Thursday and retreats further from a three-week high, around the 0.6235 region touched the previous day. The pair maintains its offered tone following the release of mostly disappointing Chinese macro data and currently trades around the 0.6165-0.6170 region, down over 0.60% for the day.
The National Bureau of Statistics (NBS) reported that China’s Retail Sales rose 12.7% YoY in May as compared to the 13.6% growth anticipated and 18.4% increase recorded in the previous month. Furthermore, China’s Industrial Production came in at 3.5% YoY against the 3.6% estimated and 5.6% prior. Meanwhile, the Fixed Asset Investment increased 4.0% YTD YoY in May vs 4.4% expected and 4.7% last. The data fuels concerns about slowing growth in the world’s largest economy and weigh on antipodean currencies, including the Kiwi.
The New Zealand (NZD) is further undermined by dismal domestic data, showing that the economy contracted by 0.1% in the first quarter and slipped into a technical recession. This comes on the back of the Reserve Bank of New Zealand’s (RBNZ) explicit signal that it was done with its most aggressive hiking cycle since 1999 and prompts aggressive selling around the NZD/USD pair. Apart from this, a modest US Dollar (USD) turns out to be another factor that contributes to the offered tone surrounding the major.
In fact, the USD Index (DXY), which tracks the Greenback against a basket of currencies, builds on the overnight bounce from a one-month low in the wake of the Federal Reserve’s (Fed) hawkish outlook and the intent to resume the rate-hiking cycle. In fact, the US central bank signalled that borrowing costs will increase by another 50 bps by end-December. The markets were quick to react and are now pricing in a greater chance of another 25 bps lift-off in July, which underpins the buck and exerts pressure on the NZD/USD pair.
The aforementioned fundamental backdrop seems tilted in favour of bearish traders. Even from a technical perspective, the overnight failure near the very important 200-day Simple Moving Average (SMA) suggests that the path of least resistance for the NZD/USD pair is to the downside. Traders now look to the US economic data – monthly Retail Sales, Weekly Initial Jobless Claims, the Empire State Manufacturing Index, the Philly Fed Manufacturing Index and Industrial Production figures – for a fresh impetus later during the early North American session.
Technical Levels: Supports and Resistances
NZDUSD currently trading at 0.6167 at the time of writing. Pair opened at 0.6206 and is trading with a change of -0.63 % .
| Overview | Overview.1 | |
|---|---|---|
| 0 | Today last price | 0.6167 |
| 1 | Today Daily Change | -0.0039 |
| 2 | Today Daily Change % | -0.6300 |
| 3 | Today daily open | 0.6206 |
The pair is trading above its 20 Daily moving average @ 0.6113, below its 50 Daily moving average @ 0.6179 , below its 100 Daily moving average @ 0.6224 and above its 200 Daily moving average @ 0.615
| Trends | Trends.1 | |
|---|---|---|
| 0 | Daily SMA20 | 0.6113 |
| 1 | Daily SMA50 | 0.6179 |
| 2 | Daily SMA100 | 0.6224 |
| 3 | Daily SMA200 | 0.6150 |
The previous day high was 0.6236 while the previous day low was 0.6133. The daily 38.2% Fib levels comes at 0.6197, expected to provide resistance. Similarly, the daily 61.8% fib level is at 0.6173, expected to provide resistance.
Note the levels of interest below:
- Pivot support is noted at 0.6147, 0.6089, 0.6044
- Pivot resistance is noted at 0.6251, 0.6295, 0.6354
| Levels | Levels.1 |
|---|---|
| Previous Daily High | 0.6236 |
| Previous Daily Low | 0.6133 |
| Previous Weekly High | 0.6143 |
| Previous Weekly Low | 0.6026 |
| Previous Monthly High | 0.6385 |
| Previous Monthly Low | 0.5985 |
| Daily Fibonacci 38.2% | 0.6197 |
| Daily Fibonacci 61.8% | 0.6173 |
| Daily Pivot Point S1 | 0.6147 |
| Daily Pivot Point S2 | 0.6089 |
| Daily Pivot Point S3 | 0.6044 |
| Daily Pivot Point R1 | 0.6251 |
| Daily Pivot Point R2 | 0.6295 |
| Daily Pivot Point R3 | 0.6354 |
[/s2If]
Nehcap Expert Advisor
The NEHCAP MT4 EA is high quality professional trading system geared to generate returns without using GRID or martingales. Each trade has strict risk per trade parameter. The pairs under management include EURUSD, GBPUSD, AUDCAD, AUDNZD,GBPAUD, EURAUD, EURCAD, CHFJPY and many more.
The system is trading live: LIVE ACCOUNT TRACKING
You can run it free. Apply for a free trial and track our account. Buy the system or use profit share mechanism to generate returns on your MT4.
Join Our Telegram Group
")


