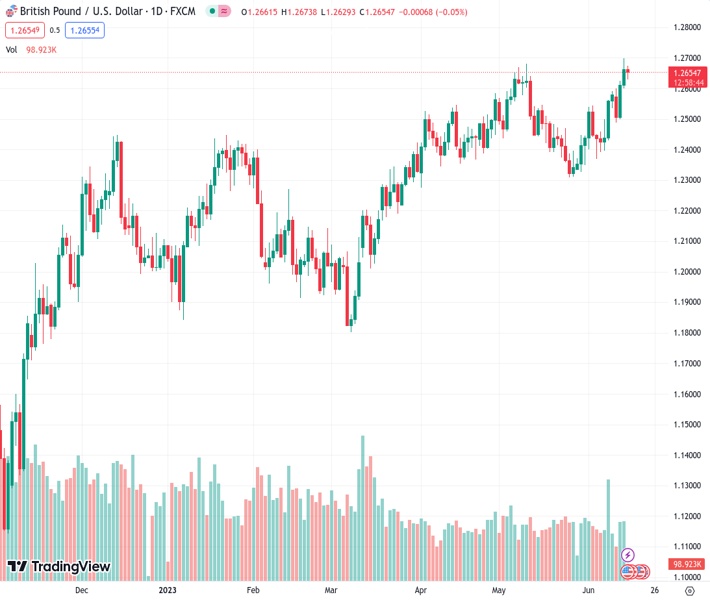
The GBPUSD currency pair, currently at a rate of 1.26565, is moving further away from its peak of over a year ago, as it faces increased pressure from a strong demand for the US dollar.
…
This is a premium post.
[s2If !current_user_can(access_s2member_level4)]Please register for FREE REGISTER to read full post below containing analysis. In case of any error or you think you are not able to read the full post below, please email us at support#nehcap.com [lwa][/s2If] [s2If current_user_can(access_s2member_level1)]
- GBP/USD retreats further from over a one-year top and is pressured by resurgent USD demand.
The pair currently trades last at 1.26565.
The previous day high was 1.2699 while the previous day low was 1.2601. The daily 38.2% Fib levels comes at 1.2662, expected to provide resistance. Similarly, the daily 61.8% fib level is at 1.2638, expected to provide support.
The GBP/USD pair comes under some selling pressure on Thursday and extends the previous day’s modest pullback from the 1.2700 neighbourhood, or its highest level since April 2022. The pair maintains its offered tone through the early European session and currently trades around the 1.2640 area, just a few pips above the daily low.
The US Dollar (USD) makes a solid comeback and snaps a two-day losing streak to a one-month low touched on Wednesday, which, in turn, is seen as a key factor exerting some downward pressure on the GBP/USD pair. The initial market reaction to the Federal Reserve’s (Fed) decision to pause its rate-hiking cycle turns out to be short-lived in the wake of a more hawkish outlook, signalling that borrowing costs may still need to rise by as much as 50 bps by the end of this year.
In fact, the so-called “dot plot” indicated that officials now see rates peaking at 5.6% this year, higher than March’s projection of 5.1%. The Fed also sees slightly stronger economic growth and forecasts the economy to grow by 1% this year — up from the 0.4% rise projected in May — before rising 1.1% in 2024 and 1.8% in 2025. This triggers a fresh leg up in the US Treasury bond yields. This, along with a softer risk tone, helps revive demand for the safe-haven buck.
The market sentiment remains fragile in the wake of worries about a global economic slowdown, particularly in China. The fears were further fueled by the disappointing Chinese macro data released earlier today, which tempers investors’ appetite for riskier assets and largely overshadows a move by the People’s Bank of China (PBOC) to cut rates on its medium-term loans. The anti-risk flow boosts demand for traditional safe-haven assets and further benefits the Greenback.
The downside for the GBP/USD pair, however, remains cushioned on the back of expectations that the Bank of England (BoE) will be far more aggressive in policy tightening to contain stubbornly high inflation. In fact, the markets have been pricing in another 25 bps BoE rate hike on June 22 and the bets were reaffirmed by the upbeat UK jobs data released on Tuesday, which showed little signs of cooling off. This, in turn, warrants some caution for aggressive bearish traders.
Market participants now look forward to the US economic docket, featuring the release of monthly Retail Sales, Weekly Initial Jobless Claims, the Empire State Manufacturing Index, Philly Fed Manufacturing Index and Industrial Production. This, along with the US bond yields and the broader risk sentiment, will influence the USD price dynamics and provide a fresh impetus to the GBP/USD pair later during the early North American session.
Technical Levels: Supports and Resistances
GBPUSD currently trading at 1.2644 at the time of writing. Pair opened at 1.2666 and is trading with a change of -0.17 % .
| Overview | Overview.1 | |
|---|---|---|
| 0 | Today last price | 1.2644 |
| 1 | Today Daily Change | -0.0022 |
| 2 | Today Daily Change % | -0.1700 |
| 3 | Today daily open | 1.2666 |
The pair remains strongly bullish on the daily timeframe. It trades above its 20 SMA @ 1.2457, 50 SMA 1.2477, 100 SMA @ 1.2316 and 200 SMA @ 1.2032.
| Trends | Trends.1 | |
|---|---|---|
| 0 | Daily SMA20 | 1.2457 |
| 1 | Daily SMA50 | 1.2477 |
| 2 | Daily SMA100 | 1.2316 |
| 3 | Daily SMA200 | 1.2032 |
The previous day high was 1.2699 while the previous day low was 1.2601. The daily 38.2% Fib levels comes at 1.2662, expected to provide resistance. Similarly, the daily 61.8% fib level is at 1.2638, expected to provide support.
Note the levels of interest below:
- Pivot support is noted at 1.2612, 1.2558, 1.2514
- Pivot resistance is noted at 1.271, 1.2753, 1.2808
| Levels | Levels.1 |
|---|---|
| Previous Daily High | 1.2699 |
| Previous Daily Low | 1.2601 |
| Previous Weekly High | 1.2590 |
| Previous Weekly Low | 1.2369 |
| Previous Monthly High | 1.2680 |
| Previous Monthly Low | 1.2308 |
| Daily Fibonacci 38.2% | 1.2662 |
| Daily Fibonacci 61.8% | 1.2638 |
| Daily Pivot Point S1 | 1.2612 |
| Daily Pivot Point S2 | 1.2558 |
| Daily Pivot Point S3 | 1.2514 |
| Daily Pivot Point R1 | 1.2710 |
| Daily Pivot Point R2 | 1.2753 |
| Daily Pivot Point R3 | 1.2808 |
[/s2If]
Nehcap Expert Advisor
The NEHCAP MT4 EA is high quality professional trading system geared to generate returns without using GRID or martingales. Each trade has strict risk per trade parameter. The pairs under management include EURUSD, GBPUSD, AUDCAD, AUDNZD,GBPAUD, EURAUD, EURCAD, CHFJPY and many more.
The system is trading live: LIVE ACCOUNT TRACKING
You can run it free. Apply for a free trial and track our account. Buy the system or use profit share mechanism to generate returns on your MT4.
Join Our Telegram Group
")


