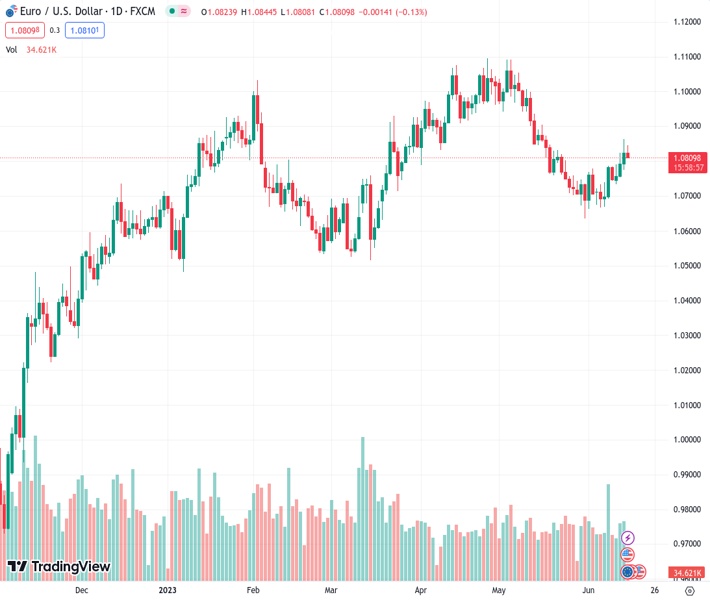
The EURUSD currency pair, currently at 1.08122, is moving away from a top it has held for multiple weeks due to increased pressure from a more powerful USD.
…
This is a premium post.
[s2If !current_user_can(access_s2member_level4)]Please register for FREE REGISTER to read full post below containing analysis. In case of any error or you think you are not able to read the full post below, please email us at support#nehcap.com [lwa][/s2If] [s2If current_user_can(access_s2member_level1)]
- EUR/USD retreats further from a multi-week top and is pressured by a stronger USD.
The pair currently trades last at 1.08122.
The previous day high was 1.0864 while the previous day low was 1.0774. The daily 38.2% Fib levels comes at 1.083, expected to provide resistance. Similarly, the daily 61.8% fib level is at 1.0808, expected to provide support.
The EUR/USD pair attracts some selling following an early uptick to the 1.0845 region during the Asian session on Thursday and retreats further from a nearly one-month high touched the previous day. The pair currently trades near the lower end of its intraday trading range, just above the 1.0800 mark, and for now, seems to have snapped a three-day winning streak, though any meaningful downside seems elusive.
The US Dollar (USD) makes a solid comeback and reverses the previous day’s slide to its lowest level since May 16, which, in turn, is seen as a key factor exerting some downward pressure on the EUR/USD pair. The strong USD bounce comes on the back of the Federal Reserve’s (Fed) hawkish outlook and the intent to resume the rate-hiking cycle. It is worth recalling that the Fed, held interest rates steady at the end of a two-day policy meeting on Wednesday, as expected, but signalled that borrowing costs may still need to rise by as much as 50 bps by the end of this year.
In fact, the so-called “dot plot” indicated that officials now see rates peaking at 5.6% this year, higher than March’s projection of 5.1%. The Fed also sees slightly stronger economic growth and forecasts the economy to grow by 1% this year — up from the 0.4% rise projected in May — before rising 1.1% in 2024 and 1.8% in 2025. This triggers a fresh leg up in the US Treasury bond yields and helps revive the USD demand. Apart from this, a softer tone around the equity markets underpins the safe-haven buck and contributes to the offered tone surrounding the EUR/USD pair.
Traders, however, might refrain from placing aggressive bearish bets ahead of the highly-anticipated European Central Bank (ECB) meeting later this Thursday. The ECB is all but certain to hike interest rates by 25 bps – to their highest level in 22 years – and leave the door open for further policy tightening to combat high inflation. It is worth mentioning that the headline CPI in the Eurozone decelerate to 6.1% in May, though is still more than three times the ECB’s 2% target. Moreover, the core CPI, which excludes food and energy prices, has just started showing signs of slowing.
The aforementioned mixed fundamental backdrop, along with the overnight sustained break and acceptance above the 100-day Simple Moving Average (SMA), support prospects for the emergence of some dip-buying around the EUR/USD pair. Hence, it will be prudent to wait for strong follow-through selling before confirming that the recent positive move witnessed over the past week or so has run its course and positioning for any meaningful downside.
Technical Levels: Supports and Resistances
EURUSD currently trading at 1.0812 at the time of writing. Pair opened at 1.0828 and is trading with a change of -0.15 % .
| Overview | Overview.1 | |
|---|---|---|
| 0 | Today last price | 1.0812 |
| 1 | Today Daily Change | -0.0016 |
| 2 | Today Daily Change % | -0.1500 |
| 3 | Today daily open | 1.0828 |
The pair is trading above its 20 Daily moving average @ 1.0749, below its 50 Daily moving average @ 1.0878 , above its 100 Daily moving average @ 1.0806 and above its 200 Daily moving average @ 1.0533
| Trends | Trends.1 | |
|---|---|---|
| 0 | Daily SMA20 | 1.0749 |
| 1 | Daily SMA50 | 1.0878 |
| 2 | Daily SMA100 | 1.0806 |
| 3 | Daily SMA200 | 1.0533 |
The previous day high was 1.0864 while the previous day low was 1.0774. The daily 38.2% Fib levels comes at 1.083, expected to provide resistance. Similarly, the daily 61.8% fib level is at 1.0808, expected to provide support.
Note the levels of interest below:
- Pivot support is noted at 1.078, 1.0732, 1.069
- Pivot resistance is noted at 1.087, 1.0912, 1.0961
| Levels | Levels.1 |
|---|---|
| Previous Daily High | 1.0864 |
| Previous Daily Low | 1.0774 |
| Previous Weekly High | 1.0787 |
| Previous Weekly Low | 1.0667 |
| Previous Monthly High | 1.1092 |
| Previous Monthly Low | 1.0635 |
| Daily Fibonacci 38.2% | 1.0830 |
| Daily Fibonacci 61.8% | 1.0808 |
| Daily Pivot Point S1 | 1.0780 |
| Daily Pivot Point S2 | 1.0732 |
| Daily Pivot Point S3 | 1.0690 |
| Daily Pivot Point R1 | 1.0870 |
| Daily Pivot Point R2 | 1.0912 |
| Daily Pivot Point R3 | 1.0961 |
[/s2If]
Nehcap Expert Advisor
The NEHCAP MT4 EA is high quality professional trading system geared to generate returns without using GRID or martingales. Each trade has strict risk per trade parameter. The pairs under management include EURUSD, GBPUSD, AUDCAD, AUDNZD,GBPAUD, EURAUD, EURCAD, CHFJPY and many more.
The system is trading live: LIVE ACCOUNT TRACKING
You can run it free. Apply for a free trial and track our account. Buy the system or use profit share mechanism to generate returns on your MT4.
Join Our Telegram Group
")


