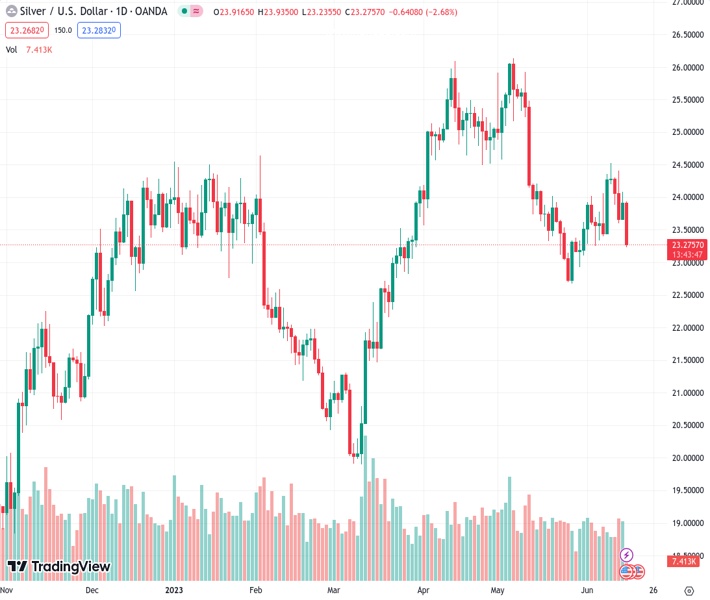
Silver encounters a new influx of supply on Thursday, causing it to decrease in value and reach a low point not seen in a week, with the XAGUSD standing at 23.274.
…
This is a premium post.
[s2If !current_user_can(access_s2member_level4)]Please register for FREE REGISTER to read full post below containing analysis. In case of any error or you think you are not able to read the full post below, please email us at support#nehcap.com [lwa][/s2If] [s2If current_user_can(access_s2member_level1)]
- Silver meets with a fresh supply on Thursday and drops to a one-week low.
The pair currently trades last at 23.274.
The previous day high was 24.08 while the previous day low was 23.66. The daily 38.2% Fib levels comes at 23.92, expected to provide resistance. Similarly, the daily 61.8% fib level is at 23.82, expected to provide resistance.
Silver struggles to capitalize on the previous day’s positive move and comes under heavy selling pressure on Thursday, hitting a one-week low heading into the European session. The white metal currently trades just below mid-$23.00s, down around 2% for the day, and seems vulnerable to weaken further.
From a technical perspective, the recent failure near the $24.50-$24.55 area, representing the 50% Fibonacci retracement level of the downfall witnessed in May, and the subsequent break below the 200-hour Simple Moving Average (SMA) favours bearish traders. Moreover, the XAG/USD now seems to have found acceptance below the 23.6% Fibo. level, which, along with the fact that oscillators on the daily chart have just started drifting back into the negative territory, support prospects for additional losses.
That said, the Relative Strength Index (RSI) on the 1-hour chart is already flashing oversold conditions, making it prudent to wait for some intraday consolidation or a modest bounce before placing fresh bearish bets. Nevertheless, the XAG/USD remains on track to slide further below the $23.00 mark and test the $22.70-$22.65 region, or a two-month low touched in May. The downward trajectory could get extended further and drag the commodity further towards the $22.00 round figure.
On the flip side, an attempted recovery might now attract fresh sellers and remain limited near the $24.00 mark, coinciding with the 38.2% Fibo. level. That said, a sustained strength beyond might trigger a short-covering rally towards the $24.50-$24.55 supply zone, or the 50% Fibo. level. The XAG/USD might then climb back to reclaim the $25.00 psychological mark and then accelerate the momentum further towards the $25.35-$25.40 resistance zone. Bullish trders could eventually aim to conquer the $26.00 mark.
Technical Levels: Supports and Resistances
XAGUSD currently trading at 23.44 at the time of writing. Pair opened at 23.93 and is trading with a change of -2.05 % .
| Overview | Overview.1 | |
|---|---|---|
| 0 | Today last price | 23.44 |
| 1 | Today Daily Change | -0.49 |
| 2 | Today Daily Change % | -2.05 |
| 3 | Today daily open | 23.93 |
The pair is trading below its 20 Daily moving average @ 23.59, below its 50 Daily moving average @ 24.47 , above its 100 Daily moving average @ 23.36 and above its 200 Daily moving average @ 22.35
| Trends | Trends.1 | |
|---|---|---|
| 0 | Daily SMA20 | 23.59 |
| 1 | Daily SMA50 | 24.47 |
| 2 | Daily SMA100 | 23.36 |
| 3 | Daily SMA200 | 22.35 |
The previous day high was 24.08 while the previous day low was 23.66. The daily 38.2% Fib levels comes at 23.92, expected to provide resistance. Similarly, the daily 61.8% fib level is at 23.82, expected to provide resistance.
Note the levels of interest below:
- Pivot support is noted at 23.7, 23.46, 23.27
- Pivot resistance is noted at 24.12, 24.32, 24.55
| Levels | Levels.1 |
|---|---|
| Previous Daily High | 24.08 |
| Previous Daily Low | 23.66 |
| Previous Weekly High | 24.53 |
| Previous Weekly Low | 23.25 |
| Previous Monthly High | 26.14 |
| Previous Monthly Low | 22.68 |
| Daily Fibonacci 38.2% | 23.92 |
| Daily Fibonacci 61.8% | 23.82 |
| Daily Pivot Point S1 | 23.70 |
| Daily Pivot Point S2 | 23.46 |
| Daily Pivot Point S3 | 23.27 |
| Daily Pivot Point R1 | 24.12 |
| Daily Pivot Point R2 | 24.32 |
| Daily Pivot Point R3 | 24.55 |
[/s2If]
Nehcap Expert Advisor
The NEHCAP MT4 EA is high quality professional trading system geared to generate returns without using GRID or martingales. Each trade has strict risk per trade parameter. The pairs under management include EURUSD, GBPUSD, AUDCAD, AUDNZD,GBPAUD, EURAUD, EURCAD, CHFJPY and many more.
The system is trading live: LIVE ACCOUNT TRACKING
You can run it free. Apply for a free trial and track our account. Buy the system or use profit share mechanism to generate returns on your MT4.
Join Our Telegram Group
")


