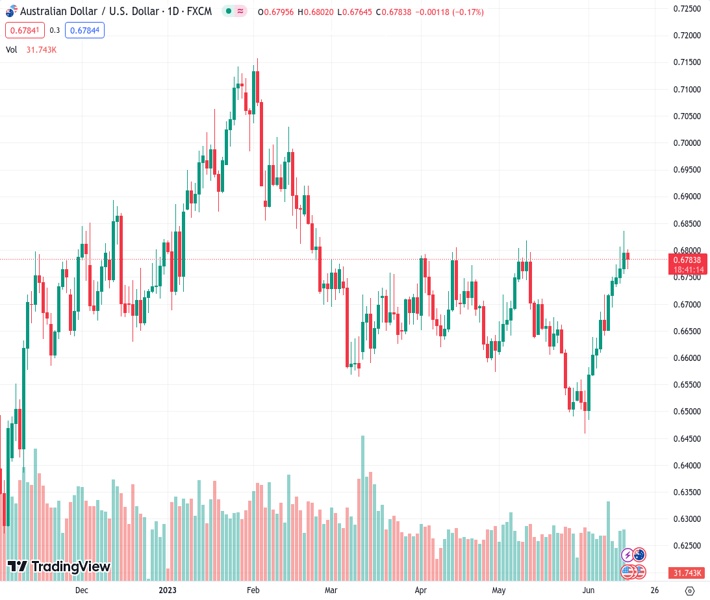
On Thursday, there was some selling pressure on #AUDUSD @ 0.67847, but the potential decline was constrained.
…
This is a premium post.
[s2If !current_user_can(access_s2member_level4)]Please register for FREE REGISTER to read full post below containing analysis. In case of any error or you think you are not able to read the full post below, please email us at support#nehcap.com [lwa][/s2If] [s2If current_user_can(access_s2member_level1)]
- AUD/USD comes under some selling pressure on Thursday, though the downside remains limited.
The pair currently trades last at 0.67847.
The previous day high was 0.6836 while the previous day low was 0.6756. The daily 38.2% Fib levels comes at 0.6805, expected to provide resistance. Similarly, the daily 61.8% fib level is at 0.6786, expected to provide resistance.
The AUD/USD pair extends the previous day’s retracement slide from the 0.6835 region, or the highest level since February 23 and drifts lower through the Asian session on Thursday. Spot prices, however, manage to recover a few pips from the daily low touched in the last hour and bounce to the 0.6785-0.6790 region following the better-than-expected release of the Australian jobs report.
The Australian Bureau of Statistics reported that the number of employed people rose by 75.9K in May as compared to consensus estimates pointing to a reading of 15K and the loss of 4.3K in the previous month. Additional details revealed that the jobless rate unexpectedly ticked lower to 3.6% from 3.7% in April. This comes on the back of the Reserve Bank of Australia’s hawkish 25 bps lift-off last week, which, in turn, benefits the Australian Dollar (AUD) and lends support to the AD/USD pair.
Spot prices, however, remain in the negative territory in the wake of a modest US Dollar (USD) strength, bolstered by the Federal Reserve’s (Fed) signal that borrowing costs will increase by another 50 bps by end-December. It is worth recalling that the US central bank, as anticipated, held interest rates steady at the end of a two-day policy meeting on Wednesday, though showed the intent to resume its policy tightening cycle and lifted bets for another 25 bps hike at the July FOMC policy meeting.
Apart from this, worries about a global economic downturn, particularly in China, might contribute to capping the upside for the AUD/USD pair, at least for the time being. Hence, the market focus now shifts to the Chinese macro data dump – Industrial Production, Retails Sales, Fixed Asset Investment and Unemployment Rate, due in a short while from now. Later during the early North American session, traders will take cues from the US economic docket – featuring Retail Sales, Weekly Initial Jobless Claims, the Empire State Manufacturing Index, the Philly Fed Manufacturing Index and Industrial Production figures.
Technical Levels: Supports and Resistances
AUDUSD currently trading at 0.677 at the time of writing. Pair opened at 0.6796 and is trading with a change of -0.38 % .
| Overview | Overview.1 | |
|---|---|---|
| 0 | Today last price | 0.6770 |
| 1 | Today Daily Change | -0.0026 |
| 2 | Today Daily Change % | -0.3800 |
| 3 | Today daily open | 0.6796 |
The pair remains strongly bullish on the daily timeframe. It trades above its 20 SMA @ 0.6627, 50 SMA 0.6664, 100 SMA @ 0.6732 and 200 SMA @ 0.6691.
| Trends | Trends.1 | |
|---|---|---|
| 0 | Daily SMA20 | 0.6627 |
| 1 | Daily SMA50 | 0.6664 |
| 2 | Daily SMA100 | 0.6732 |
| 3 | Daily SMA200 | 0.6691 |
The previous day high was 0.6836 while the previous day low was 0.6756. The daily 38.2% Fib levels comes at 0.6805, expected to provide resistance. Similarly, the daily 61.8% fib level is at 0.6786, expected to provide resistance.
Note the levels of interest below:
- Pivot support is noted at 0.6756, 0.6716, 0.6676
- Pivot resistance is noted at 0.6836, 0.6875, 0.6915
| Levels | Levels.1 |
|---|---|
| Previous Daily High | 0.6836 |
| Previous Daily Low | 0.6756 |
| Previous Weekly High | 0.6751 |
| Previous Weekly Low | 0.6579 |
| Previous Monthly High | 0.6818 |
| Previous Monthly Low | 0.6458 |
| Daily Fibonacci 38.2% | 0.6805 |
| Daily Fibonacci 61.8% | 0.6786 |
| Daily Pivot Point S1 | 0.6756 |
| Daily Pivot Point S2 | 0.6716 |
| Daily Pivot Point S3 | 0.6676 |
| Daily Pivot Point R1 | 0.6836 |
| Daily Pivot Point R2 | 0.6875 |
| Daily Pivot Point R3 | 0.6915 |
[/s2If]
Nehcap Expert Advisor
The NEHCAP MT4 EA is high quality professional trading system geared to generate returns without using GRID or martingales. Each trade has strict risk per trade parameter. The pairs under management include EURUSD, GBPUSD, AUDCAD, AUDNZD,GBPAUD, EURAUD, EURCAD, CHFJPY and many more.
The system is trading live: LIVE ACCOUNT TRACKING
You can run it free. Apply for a free trial and track our account. Buy the system or use profit share mechanism to generate returns on your MT4.
Join Our Telegram Group
")


