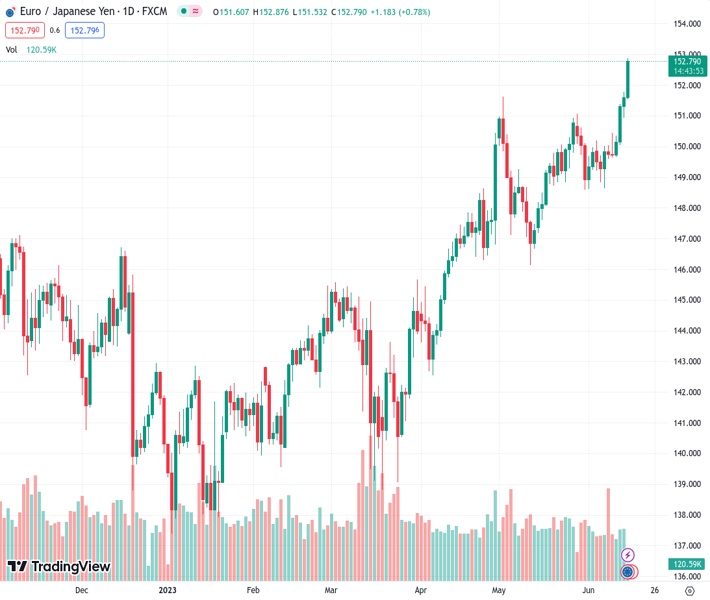
On Thursday, EURJPY reached a new multi-year high, climbing for the fourth consecutive day and currently trading at 152.765.
…
This is a premium post.
[s2If !current_user_can(access_s2member_level4)]Please register for FREE REGISTER to read full post below containing analysis. In case of any error or you think you are not able to read the full post below, please email us at support#nehcap.com [lwa][/s2If] [s2If current_user_can(access_s2member_level1)]
- EUR/JPY scales higher for the fourth straight day and spikes to a fresh multi-year high on Thursday.
The pair currently trades last at 152.765.
The previous day high was 151.78 while the previous day low was 150.92. The daily 38.2% Fib levels comes at 151.45, expected to provide support. Similarly, the daily 61.8% fib level is at 151.25, expected to provide support.
The EUR/JPY cross prolongs its weekly uptrend for the fourth successive day on Thursday and rallies to its highest level since September 2008, around the 152.85 region heading into the European session.
The Japanese Yen (JPY) continues to be undermined by a big divergence in the monetary policy stance adopted by the Bank of Japan (BoJ) and other major central banks. In fact, several BoJ officials, particularly Governor Kazuo Ueda, have signalled to stick to the ultra-loose policy settings, including the yield curve control policy, to support the economy and ensure that the recent positive signs are sustained. Apart from this, reduced bets for an intervention by the Japanese government, to stabilize the domestic currency, exert additional downward pressure on the JPY and provide a goodish lift to the EUR/JPY cross.
Apart from this, the strong intraday move up could further be attributed to some repositioning trade ahead of the European Central Bank (ECB) event risk. The ECB is scheduled to announce its policy decision later this Thursday and is all but certain to hike interest rates by 25 bps, to their highest level in 22 years. The central bank is also expected to leave the door open for further tightening to combat high inflation, which, at 6.1% in May, is still more than three times the 2% target. This contributes to the shared currency’s relative outperformance and remains supportive of the EUR/JPY pair’s sharp rise to a multi-year peak.
The positive momentum could further be attributed to some follow-through technical buying following this week’s breakout and acceptance above the 151.00 strong horizontal resistance. That said, the Relative Strength Index (RSI) on the daily chart is already flashing slightly overbought conditions, making it prudent to wait for some near-term consolidation or a modest pullback before placing fresh bullish bets around the EUR/JPY cross. Traders might also prefer to wait on the sidelines ahead of the key central bank event risks – the ECB decision and the BoJ meeting on Friday. Nevertheless, the aforementioned fundamental backdrop suggests that the path of least resistance for spot prices is to the upside.
Technical Levels: Supports and Resistances
EURJPY currently trading at 152.77 at the time of writing. Pair opened at 151.7 and is trading with a change of 0.71 % .
| Overview | Overview.1 | |
|---|---|---|
| 0 | Today last price | 152.77 |
| 1 | Today Daily Change | 1.07 |
| 2 | Today Daily Change % | 0.71 |
| 3 | Today daily open | 151.70 |
The pair remains strongly bullish on the daily timeframe. It trades above its 20 SMA @ 149.93, 50 SMA 148.49, 100 SMA @ 145.64 and 200 SMA @ 144.39.
| Trends | Trends.1 | |
|---|---|---|
| 0 | Daily SMA20 | 149.93 |
| 1 | Daily SMA50 | 148.49 |
| 2 | Daily SMA100 | 145.64 |
| 3 | Daily SMA200 | 144.39 |
The previous day high was 151.78 while the previous day low was 150.92. The daily 38.2% Fib levels comes at 151.45, expected to provide support. Similarly, the daily 61.8% fib level is at 151.25, expected to provide support.
Note the levels of interest below:
- Pivot support is noted at 151.15, 150.61, 150.29
- Pivot resistance is noted at 152.02, 152.33, 152.88
| Levels | Levels.1 |
|---|---|
| Previous Daily High | 151.78 |
| Previous Daily Low | 150.92 |
| Previous Weekly High | 150.44 |
| Previous Weekly Low | 148.63 |
| Previous Monthly High | 151.62 |
| Previous Monthly Low | 146.14 |
| Daily Fibonacci 38.2% | 151.45 |
| Daily Fibonacci 61.8% | 151.25 |
| Daily Pivot Point S1 | 151.15 |
| Daily Pivot Point S2 | 150.61 |
| Daily Pivot Point S3 | 150.29 |
| Daily Pivot Point R1 | 152.02 |
| Daily Pivot Point R2 | 152.33 |
| Daily Pivot Point R3 | 152.88 |
[/s2If]
Nehcap Expert Advisor
The NEHCAP MT4 EA is high quality professional trading system geared to generate returns without using GRID or martingales. Each trade has strict risk per trade parameter. The pairs under management include EURUSD, GBPUSD, AUDCAD, AUDNZD,GBPAUD, EURAUD, EURCAD, CHFJPY and many more.
The system is trading live: LIVE ACCOUNT TRACKING
You can run it free. Apply for a free trial and track our account. Buy the system or use profit share mechanism to generate returns on your MT4.
Join Our Telegram Group
")


