Despite the technical recession reported in the New Zealand economy, there has been a recovery in the movement of the NZDUSD at around 0.6200 from its earlier position at 0.61738.
…
This is a premium post.
[s2If !current_user_can(access_s2member_level4)]Please register for FREE REGISTER to read full post below containing analysis. In case of any error or you think you are not able to read the full post below, please email us at support#nehcap.com [lwa][/s2If] [s2If current_user_can(access_s2member_level1)]
- NZD/USD has shown a recovery move to near 0.6200 despite the NZ economy reporting a technical recession.
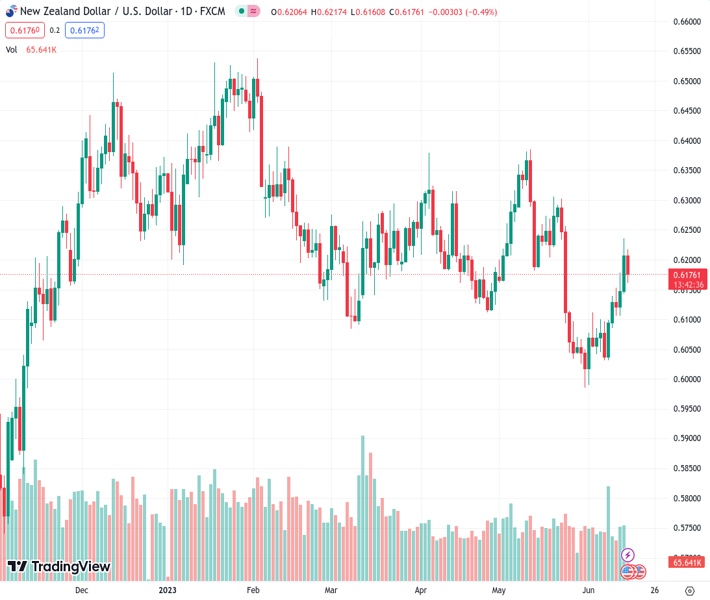
The pair currently trades last at 0.61738.
The previous day high was 0.6236 while the previous day low was 0.6133. The daily 38.2% Fib levels comes at 0.6197, expected to provide resistance. Similarly, the daily 61.8% fib level is at 0.6173, expected to provide support.
The NZD/USD pair has rebounded after sensing buying interest near 0.6160 in the early London session. The Kiwi asset is struggling to find acceptance above the round-level resistance of 0.6200 despite multiple attempts.
S&P500 futures have generated more losses as the market sentiment is turning cautious. A skip in the interest rate regime by the Federal Reserve (Fed) lacks optimism as the policy-tightening spell is not concluded now. Also, Fed chair Jerome Powell confirmed that rate cuts are not appropriate this year.
Meanwhile, the New Zealand economy has reported a technical recession as quarterly Gross Domestic Product (GDP) has contracted by 0.1% as expected. Also, the Kiwi economy reported a contraction in its former GDP figures by 0.7%. Two consecutive time contraction in quarterly GDP figures of an economy is considered a technical recession.
NZD/USD faced sheer resistance near the 61.8% Fibonacci retracement (plotted from May 11 high at 0.6385 to May 31 low at 0.5985) at 0.6230 on a four-hour scale. The downward-sloping trendline placed from May 11 high at 0.6385 will continue to provide support to the New Zealand Dollar bulls. Also, the 20-period Exponential Moving Average (EMA) at 0.6161 is acting as a cushion for the Kiwi bulls.
The Relative Strength Index (RSI) (14) is making efforts in keeping its auction in the bullish range of 60.0-80.00.
A confident break above the round-level resistance at 0.6200 will drive the Kiwi asset toward May 17 high at 0.6261 followed by May 19 high at 0.6306.
Alternatively, a downside move below the intraday low at 0.6015 will expose the asset for a fresh six-month low toward 11 November 2022 low at 0.5984. A slippage below the latter would expose the asset toward 02 November 2022 high at 0.5941.
Technical Levels: Supports and Resistances
NZDUSD currently trading at 0.6178 at the time of writing. Pair opened at 0.6206 and is trading with a change of -0.45 % .
| Overview | Overview.1 | |
|---|---|---|
| 0 | Today last price | 0.6178 |
| 1 | Today Daily Change | -0.0028 |
| 2 | Today Daily Change % | -0.4500 |
| 3 | Today daily open | 0.6206 |
The pair is trading above its 20 Daily moving average @ 0.6113, below its 50 Daily moving average @ 0.6179 , below its 100 Daily moving average @ 0.6224 and above its 200 Daily moving average @ 0.615
| Trends | Trends.1 | |
|---|---|---|
| 0 | Daily SMA20 | 0.6113 |
| 1 | Daily SMA50 | 0.6179 |
| 2 | Daily SMA100 | 0.6224 |
| 3 | Daily SMA200 | 0.6150 |
The previous day high was 0.6236 while the previous day low was 0.6133. The daily 38.2% Fib levels comes at 0.6197, expected to provide resistance. Similarly, the daily 61.8% fib level is at 0.6173, expected to provide support.
Note the levels of interest below:
- Pivot support is noted at 0.6147, 0.6089, 0.6044
- Pivot resistance is noted at 0.6251, 0.6295, 0.6354
| Levels | Levels.1 |
|---|---|
| Previous Daily High | 0.6236 |
| Previous Daily Low | 0.6133 |
| Previous Weekly High | 0.6143 |
| Previous Weekly Low | 0.6026 |
| Previous Monthly High | 0.6385 |
| Previous Monthly Low | 0.5985 |
| Daily Fibonacci 38.2% | 0.6197 |
| Daily Fibonacci 61.8% | 0.6173 |
| Daily Pivot Point S1 | 0.6147 |
| Daily Pivot Point S2 | 0.6089 |
| Daily Pivot Point S3 | 0.6044 |
| Daily Pivot Point R1 | 0.6251 |
| Daily Pivot Point R2 | 0.6295 |
| Daily Pivot Point R3 | 0.6354 |
[/s2If]
Nehcap Expert Advisor
The NEHCAP MT4 EA is high quality professional trading system geared to generate returns without using GRID or martingales. Each trade has strict risk per trade parameter. The pairs under management include EURUSD, GBPUSD, AUDCAD, AUDNZD,GBPAUD, EURAUD, EURCAD, CHFJPY and many more.
The system is trading live: LIVE ACCOUNT TRACKING
You can run it free. Apply for a free trial and track our account. Buy the system or use profit share mechanism to generate returns on your MT4.
Join Our Telegram Group
")


